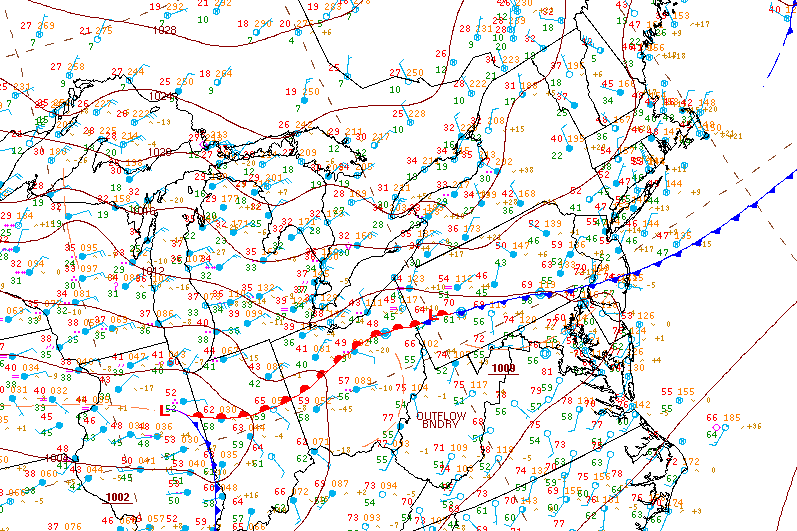
Surface analysis 15Z Thu Apr 11 2013
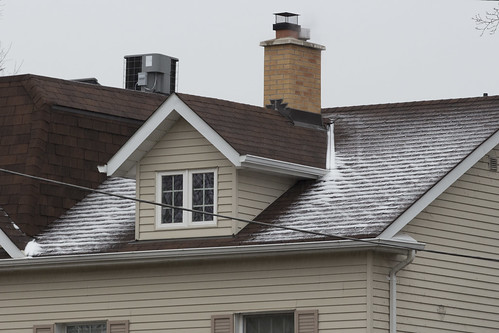
A smattering of ice pellets cover the roof of a home in Leaside, Toronto as the first wave of precipitation from the impending storm moves in
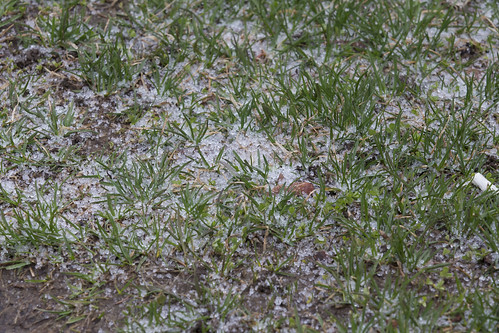
The low elevation of Leaside in Toronto allowed the snow up north to instead fall as ice pellets down in the city. The expected change over to rain was stunted as more cold air flooded in and mixing began to occur aloft.
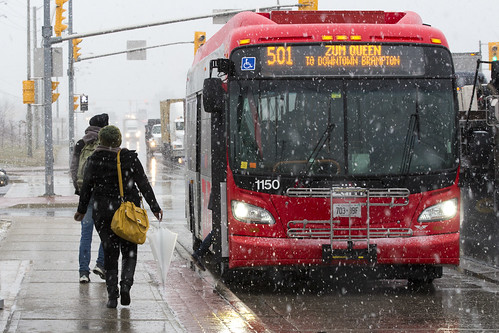
Commuters in Brampton near hwy 50 & Queen St get on a Zoom bus as heavy wet snow falls.
The snow was not expected, a combination of colder air flooding in and additional mixing aloft meant that the precipitation, which was supposed to remain as ice pellets eventually changing to rain fell almost entirely as snow with the first wave of precipitation.
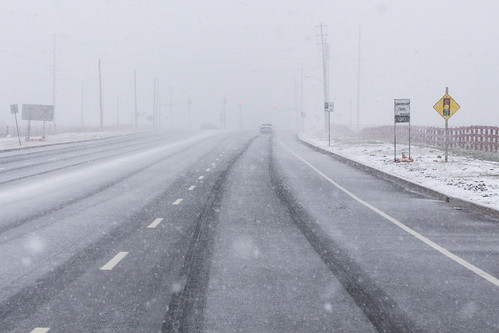
A "surprise" winter storm blankets Langstaff Rd just west of hwy 27 with a coating of wet snow.
This unusual late season storm left many municipalities unprepared to treat the icy road surfaces and commence plowing operations.
The snow also created an additional forecast element not forseen, with a fresh blanket on the ground it meant that temperatures were able to remain cooler longer and this would aid in the freezing rain process which would begin with the second wave of precipitation much later in the day towards evening.
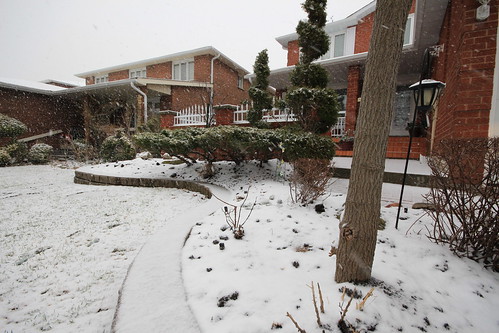
Normally at this time of the year the first spring sprouts are shooting out of the ground, but that seems unlikely given the fresh coating of snow.
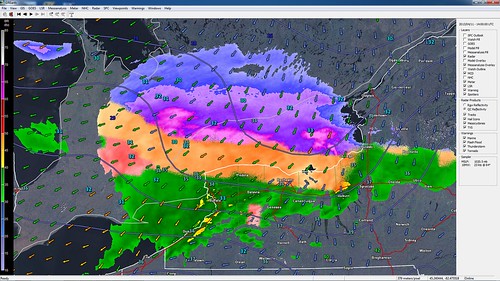
This was the radar image at the time showing just where the snow, ice pellets, freezing rain and normal rain sat. You can see the blues and purples (snow) effecting the GTA and areas eastward while much of the Hamilton, Halton and western portions of Mississauga were seeing a good mix of ice pellets (orange). Further south, along the QEW on the south shore of Lake Ontario most of the precipitation was falling as rain (green) and to the west a pocket of freezing rain (pink) had developed over Kitchener, Waterloo, Guelph and other surrounding communities due to cold air damming at the surface.
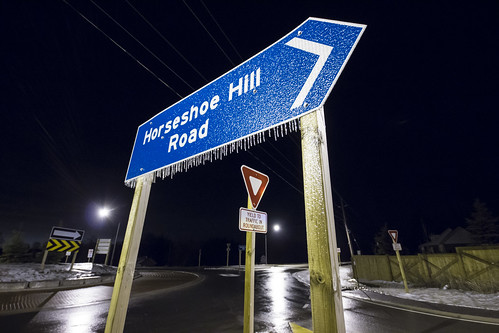
As I started my missing late at nigh to find freezing rain as the second wave of precipitation moved in ice accretion was rapidly building.
Here, a road sign stands frozen near Caledon.
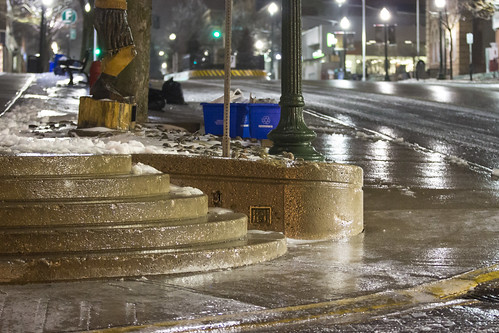
The streets of Orangeville required a pair of well sharpened skates.
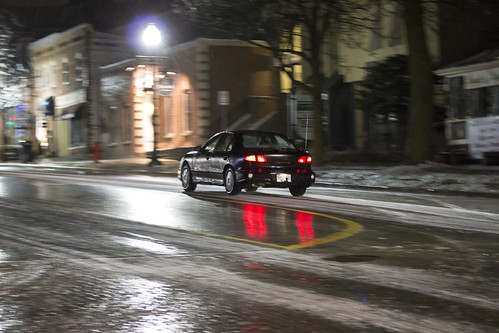
A driver heads west along an ice covered Broadway in downtown Orangeville
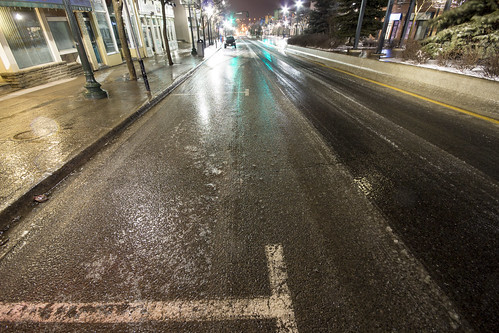
Glazed city streets
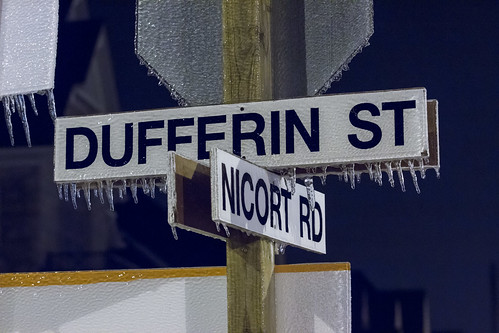
Temporary signs posted outside of a new subdivision in King City give a good idea of how icy conditions were becoming in areas that were relatively close to the big city.
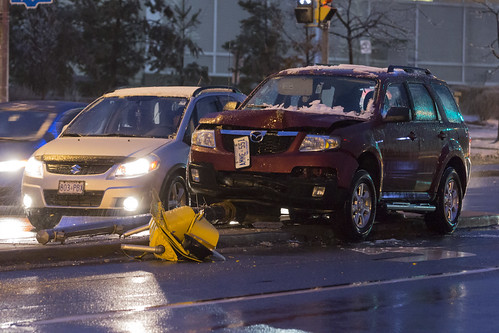
The icy roads led to a less than quick morning rush hour commute. This unfortunate driver lost control and took down a traffic signal on Dufferin just south of Steeles in Toronto (Downsview).
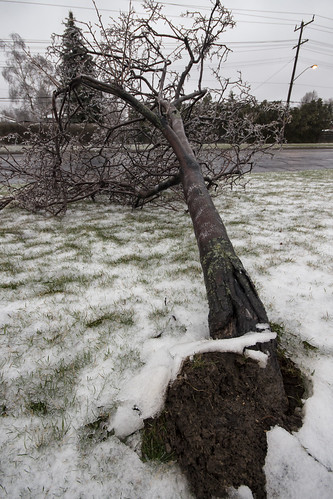
The wet soil, strong easterly winds and additional load from the ice were too much for this tree to bare.
Eventually it come toppling down near Kipling and The Westway in Toronto (Etobicoke).
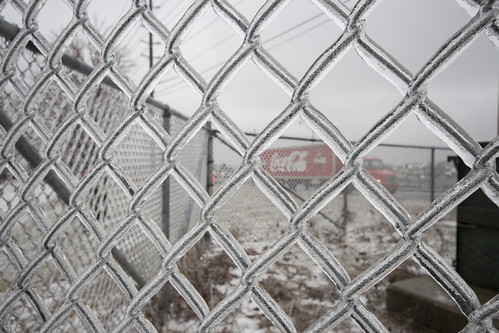
Icy geometry at its finest
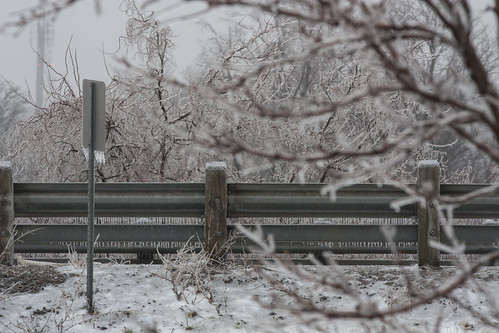
This winter-wonderland photo is the highway 400 northbound on ramp from Rutherford Rd
It was very icy!
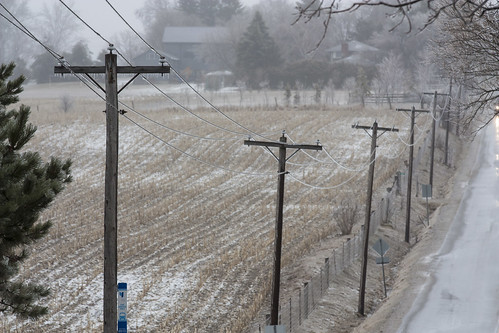
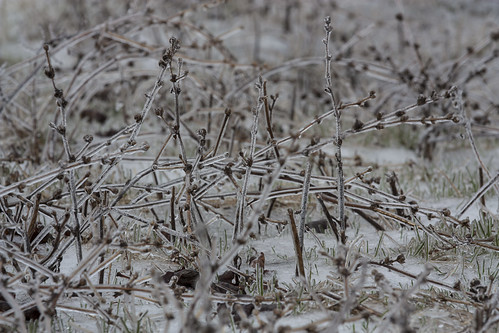
Kettleby, like King City had significant ice accretion on most objects.
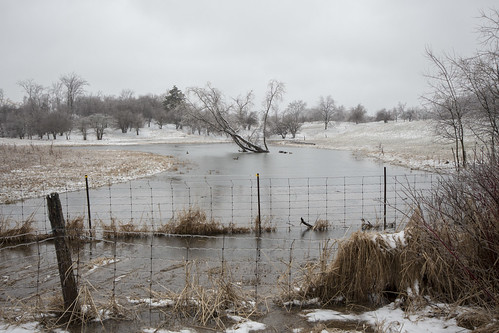
Between the still semi frozen ground and the soaking rains that have been persistent for nearly 5 full days, many fields slowly turned into small lakes. So not only was the freezing rain a nuisance for drivers and utility companies but it also added to the growing flooding situation in some places.
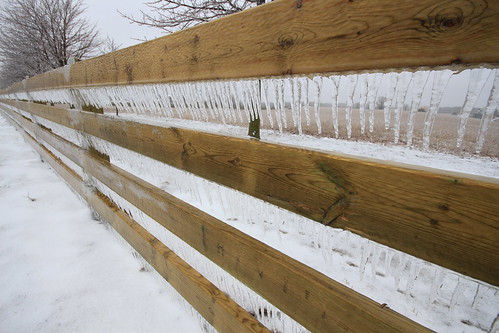
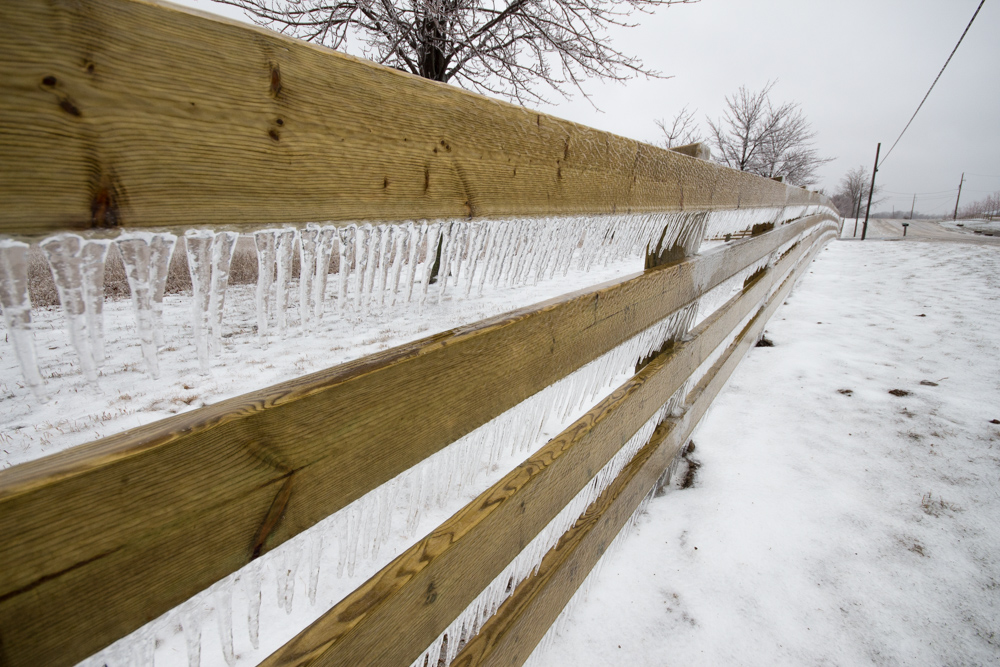
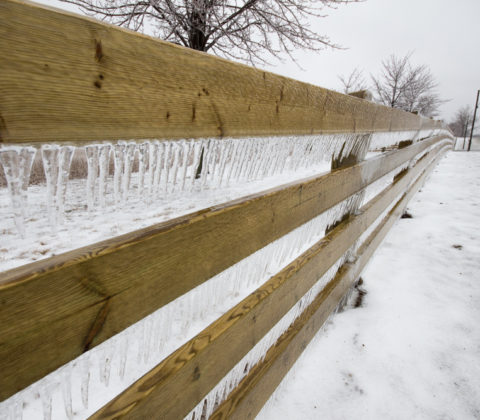
A ranch fence is covered with icicles, this is a great example of just how much rain was really coming down.
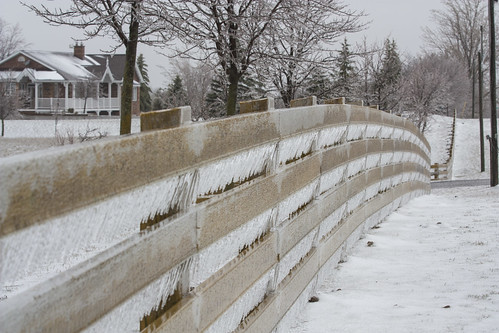
A ranch fence is covered with icicles
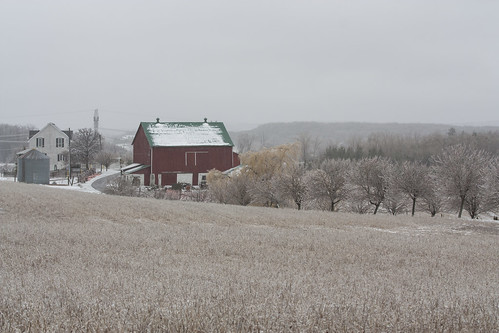
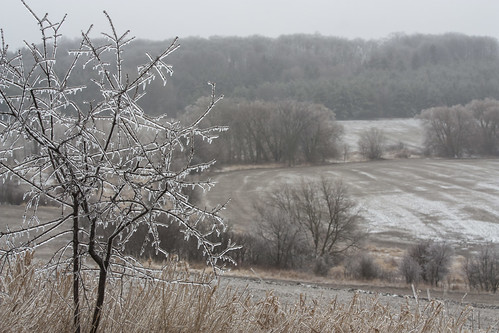
A beautiful snow and ice covered farm in Nobleton
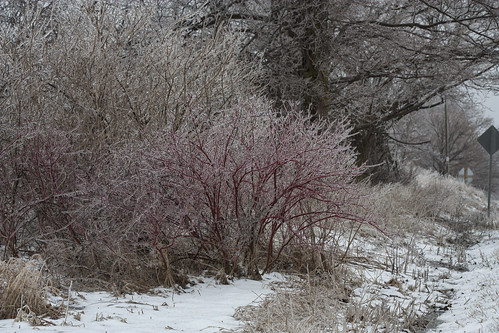
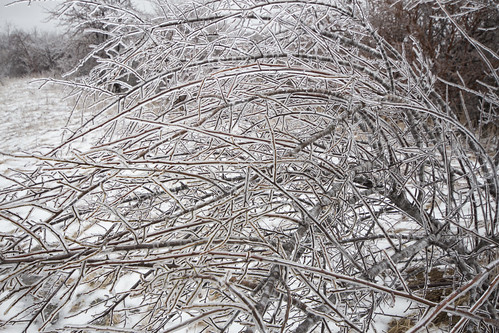
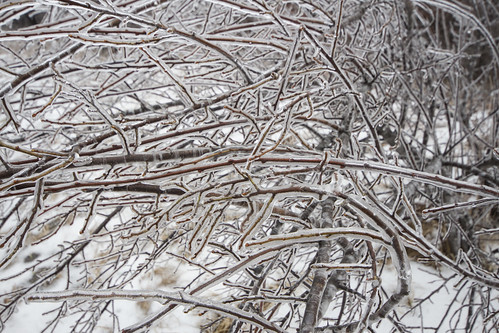
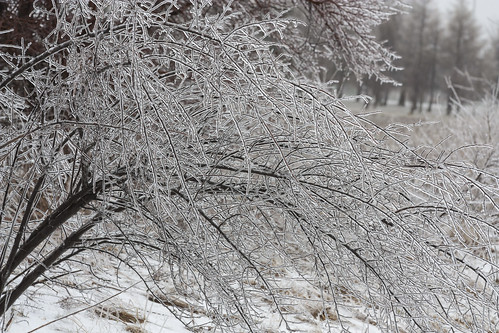
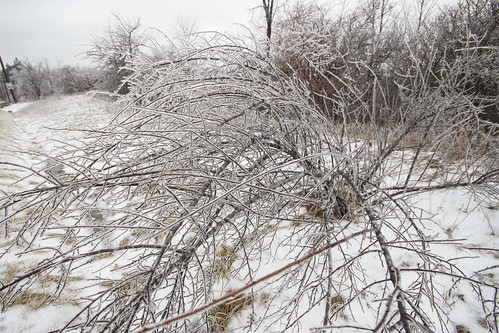
Covered in ice
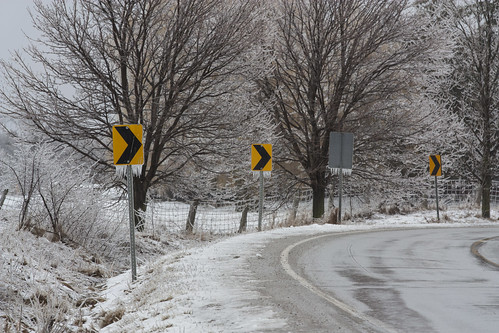
Don't take it too fast!
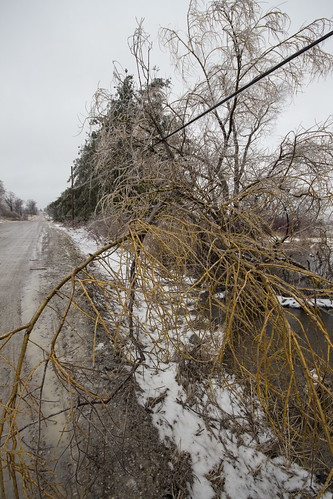
This tree not only bends down right to the road, but also stretches out across a power line. It's a good thing this particular line is fully insulated otherwise there would have been arcing and fire most likely.
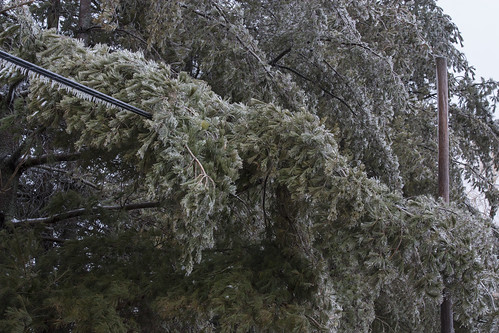
This is a perfect illustration of how & why most power outages occur.
This feeder line is fortunately insulated to prevent arcing but the weight of the branch alone in many situations is enough to bring down wires and disrupt electrical service.
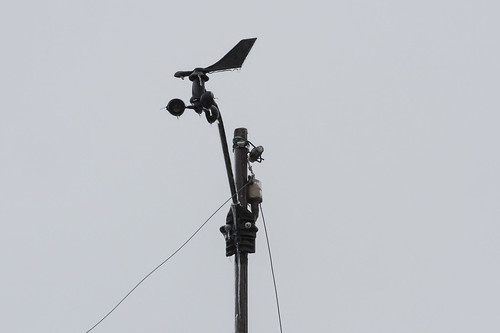
My weather station stopped providing wind data, this picture explains why.
Even in the in the 50km/h easterly winds the ice was still strong enough to overcome the spinning wind cups and freeze the unit solid.
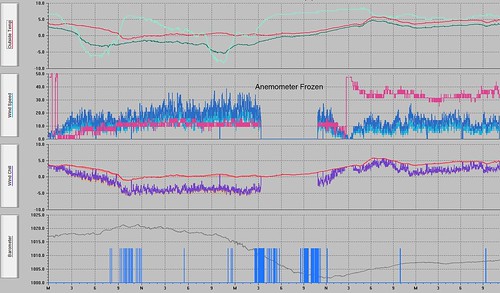
This is what the data from my weather station looked like. The chart starts at midnight on April 11th, temperatures early on remain relative warm until about 7AM which the first precipitation falls and evaporative cooling takes hold. From that point on temperatures continue to remain around the freezing mark but there is a lull in the precipitation shortly after midday. Then the second wave starts around 11PM and by 4AM on April 12th my anemometer just freezes solid. From that point on rain continues to fall and freeze until almost noon when finally the wind cups start spinning.
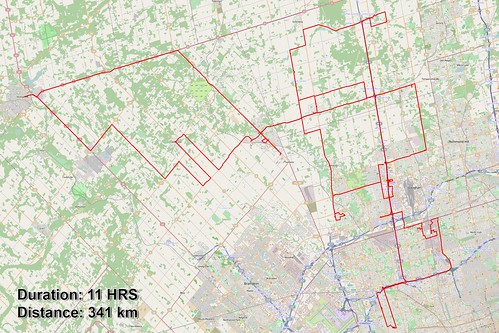
Here's the trip log, a whopping 341km and I didn't even really go that far!
It was an intense 11 hours of news gathering with taking photos on the side.
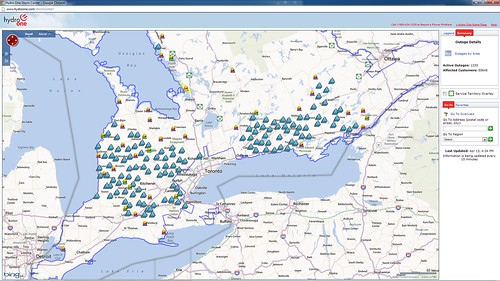
This map does not even account for the local utility companies, this is just the provincial agency that handles rural areas and primary lines. You can see there are plenty of outages!
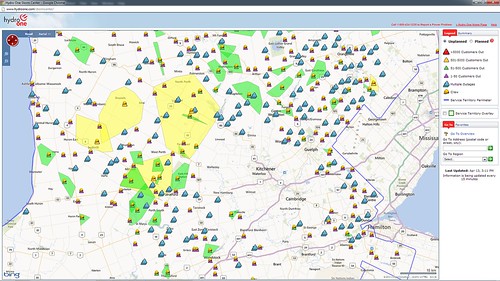
Here's a zoomed in image showing power outages in Southwestern Ontario. What a mess!
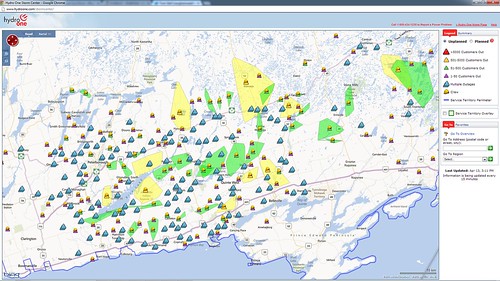
Here's a zoomed in image showing power outages in Eastern Ontario. It's an even bigger mess!
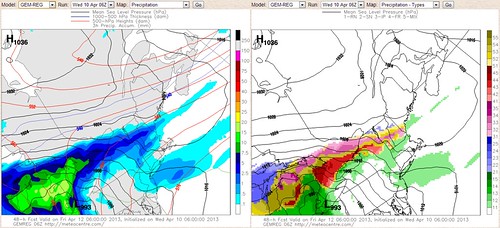
This image is showing one of the earlier REG-GEM (Regional GEM) forecasts. The model had an excellent grip on the scope of the storm and freezing rain area even though it was a full 48 hours away at the time.
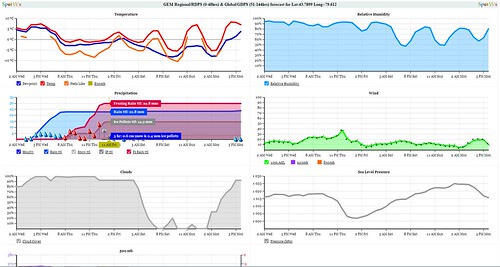
Courtesy of SpotWx here's the GEM forecast just north of my house in Vaughan.
