March 1st 2015 – Record Cold February
I’m not a climatologist and I was not around in the late the 70’s but according to the record books, this past February was certainly something record breaking to live through and challenged the February’s of 1977 through 1979.
December was relatively warm, at least compared with last year! The mean temperature was a balmy 0.0C with the coldest temperature of -10.3C having been recorded on the 2nd and the warmest high of 10.1C on the 24th. By January more polar air was making it’s way south and the mean temperature plummeted to -7.3C with the first sub -20C low being reported on the 13th when the mercury dipped to -21.4C at 7:34AM.
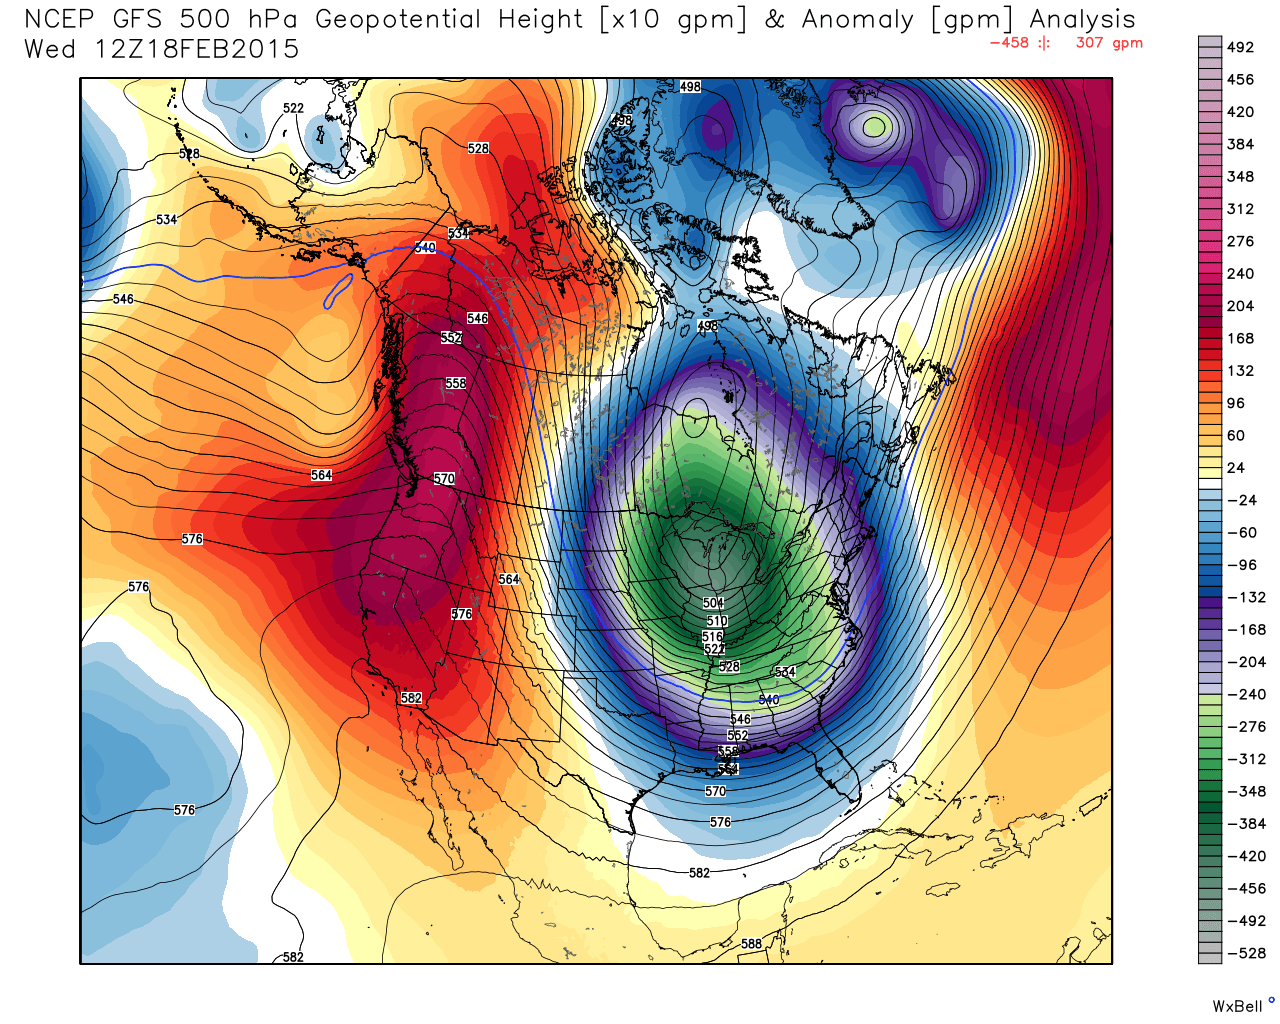
Getting into February, the first half of the month was cold with overnight lows regularly dipping into the -15C to -18C range but by the 12th things were really beginning to tank. Blocking from the west (see image above) allowed wave after wave of arctic high pressure, and I’m talking deep arctic air to dive south through Manitoba and into Ontario and Eastern Canada where we just simply froze.
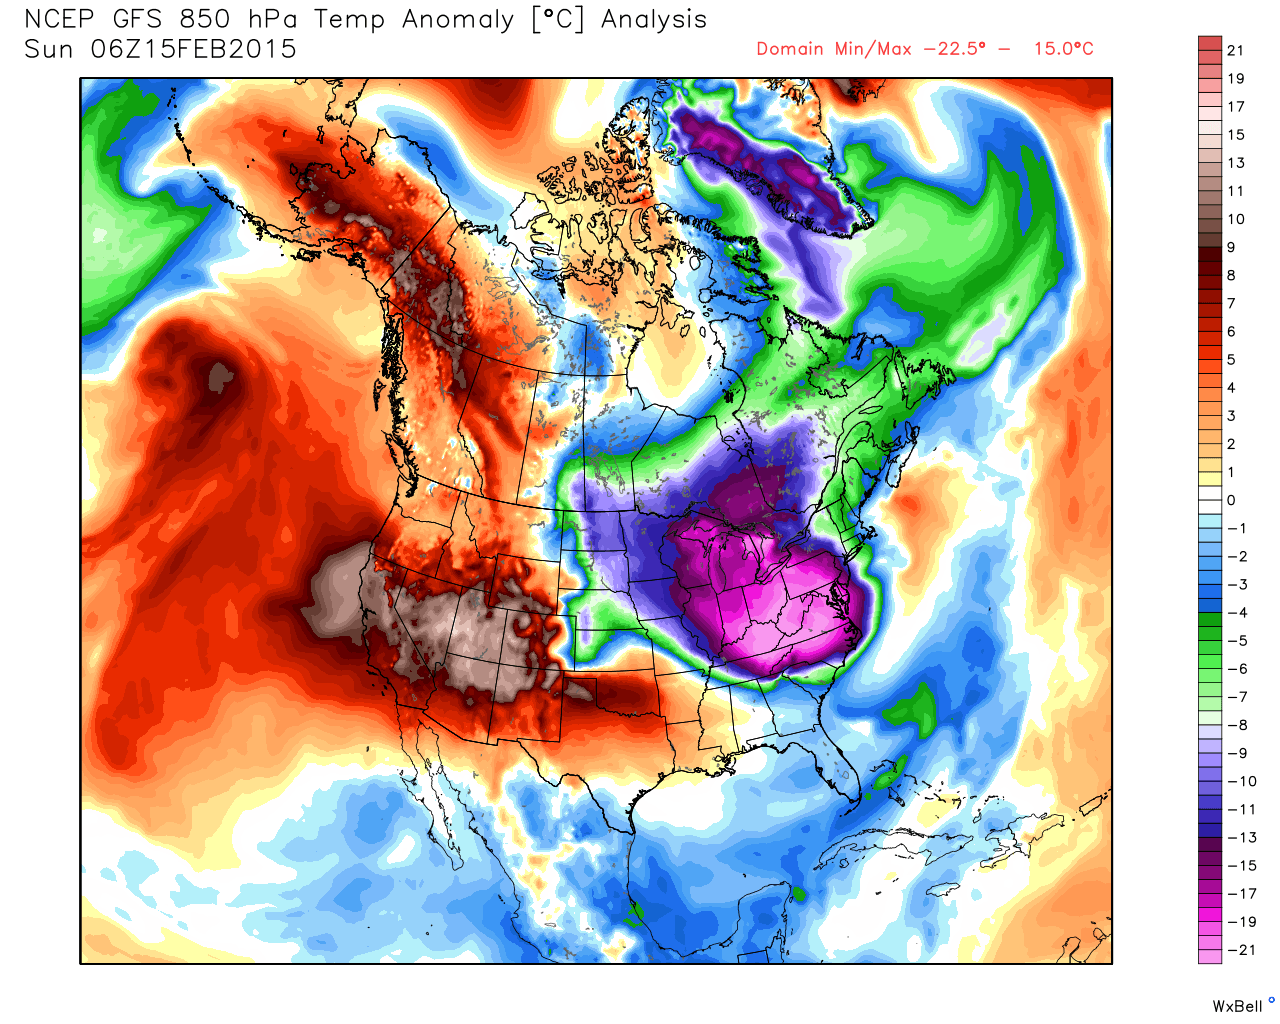
Pictured above is the 850MB temperature departure from normal on Feb 15th which was and so far remains the coldest overall day of the current winter and past winters going back to at least 2007. Not only was it just freezing, but this was the first time I’ve actually recorded a windchill in the minus 40’s. If your wondering, the windchill hit a whopping -41.7C / -43.1F at 8:06AM as the mercury dipped to -25.7C with a wind speed of 40.2 km/h pushing the scales to a new unseen low since my record keeping began back in 2010.
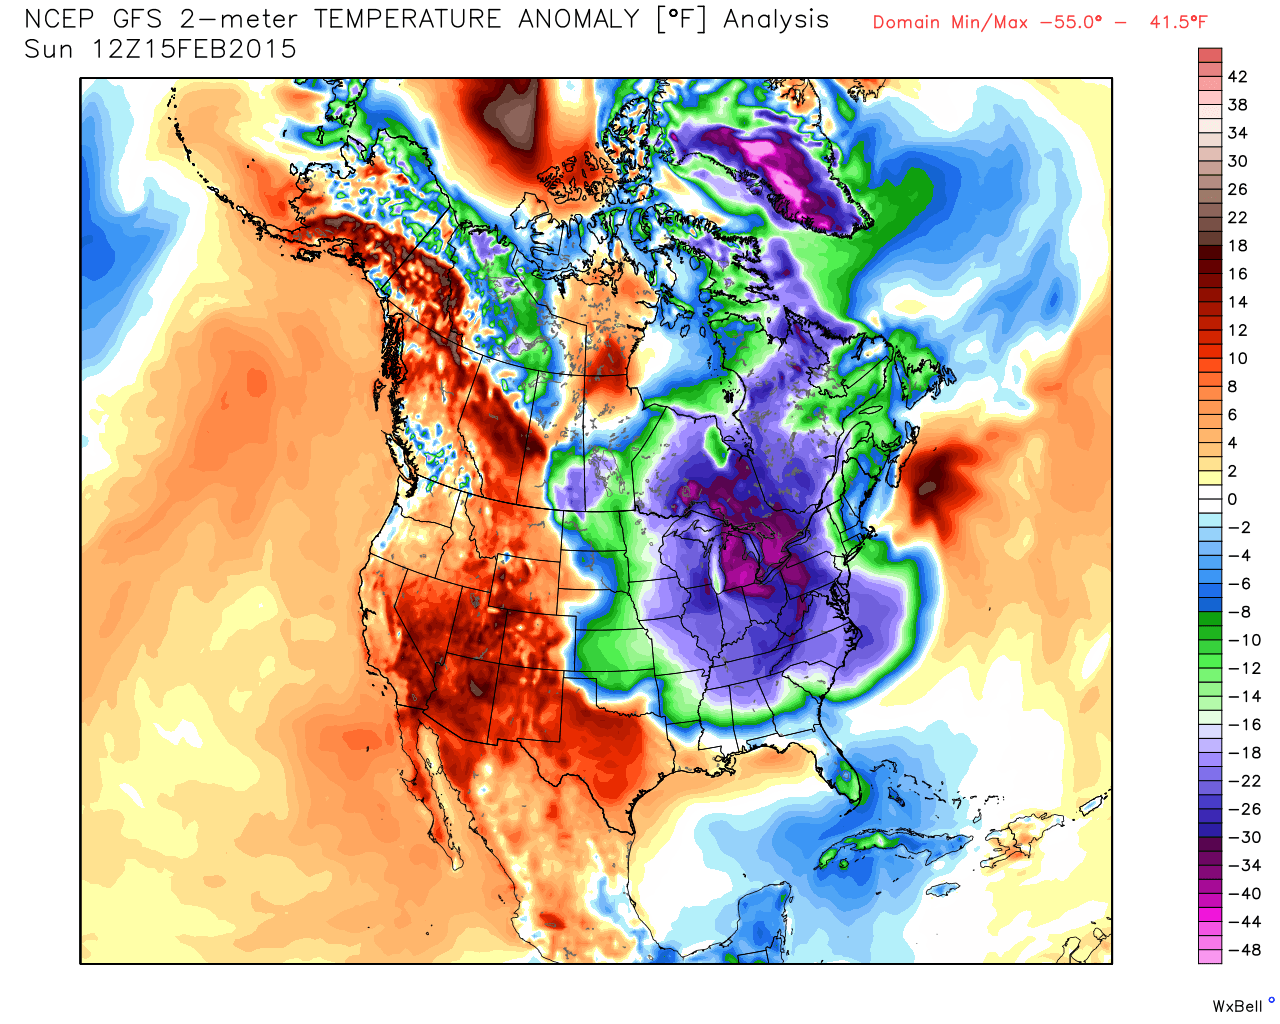
Wind chills and perceived temperatures aside, the actual 2 meter temperature departure from normal was not only on the order of some 15 degrees Celsius but the extent of the cold air was impressive with the Bahamas, Florida and Cuba getting a taste of the winter. Did I mention that much of the eastern half of North America was also freezing?
In the above graph, I’ve merged the February’s of 2012 through 2015 to show how progressively each February has actually become colder. In 2012 the mean temperature was -0.5C and by 2015 it has now dipped to -12.2C with a significant portion of that departure occurring in the second half of the month. Also interesting to note is that the entire month has been below freezing without a single day allowing for any thawing.
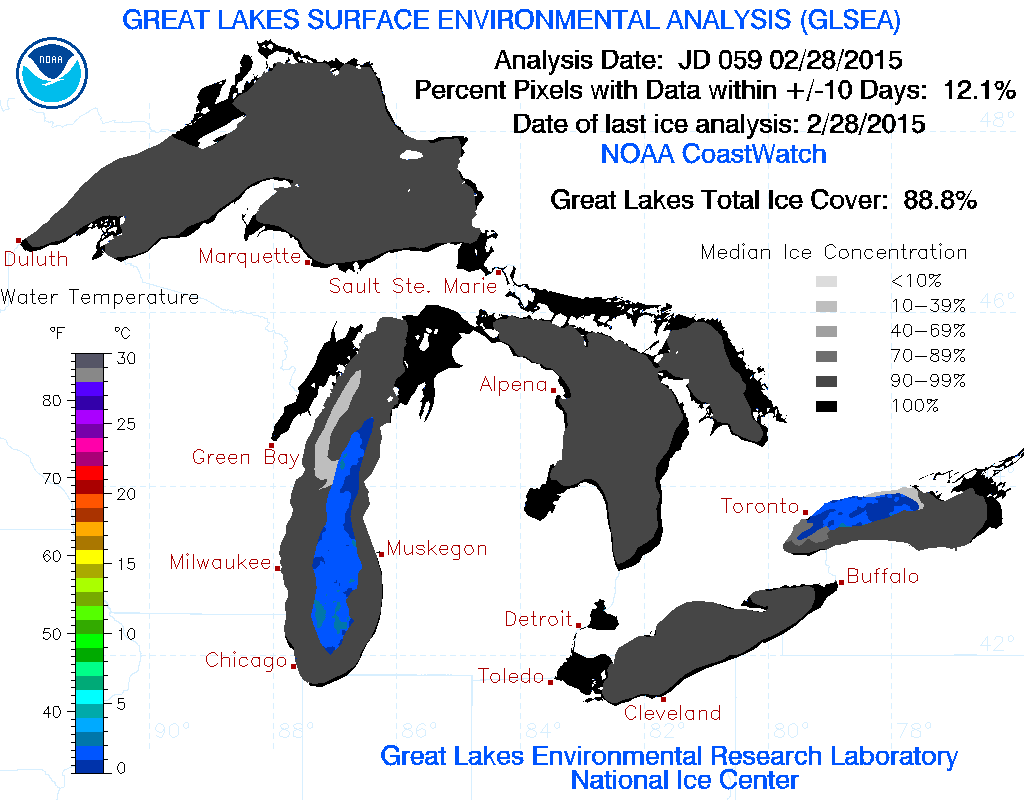
Actually the last above freezing day was January 24th which means it has been below freezing at my home in Vaughan for 35 consecutive days. This has also had the net effect of helping to lower the frost line progressively closer to the to the 60cm / 2ft mark which would be disastrous for many peoples water lines. The Great Lakes have also been feeling the brunt of the cold with ice cover reaching record levels and shipping grinding to a stand still.
The biggest question now is what will March hold? From the looks of the CFS and other climate models, the trend of cooling for the given forecast period looks to continue and spring may be much further than we would like to think!
 But in the meantime (get it? mean time?) I’ve included a map here from the CFS V2 summarizing February 2015 which has been below normal for the majority of North America and all of Greenland. The monthly climate summaries for February 2012 through 2015 are also located below.