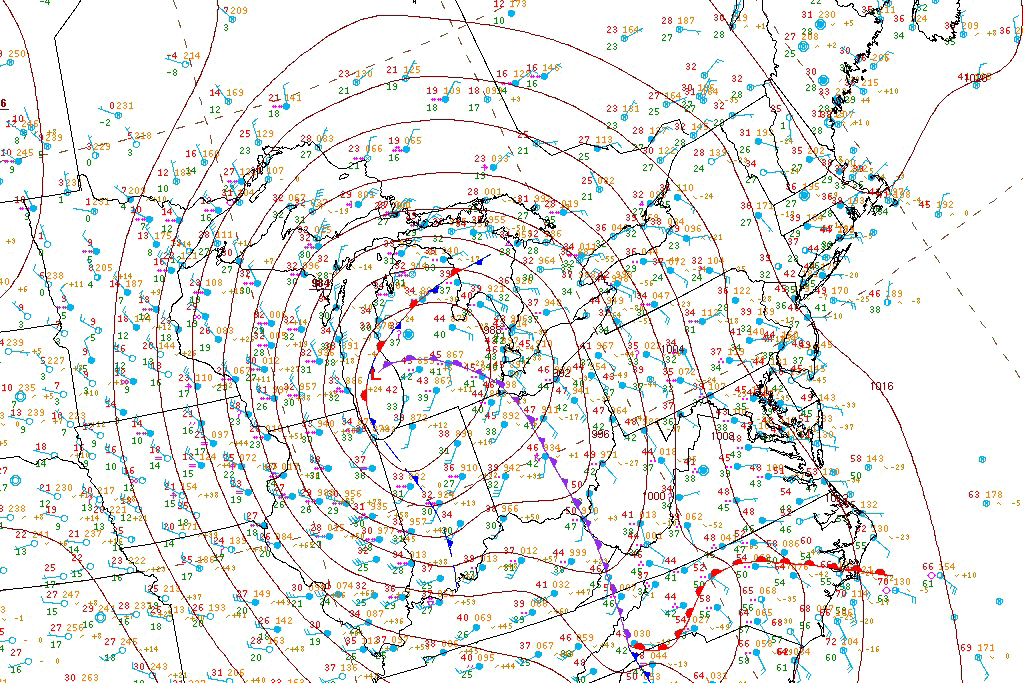
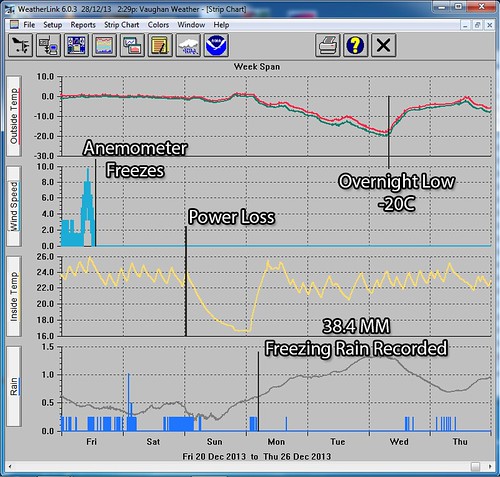
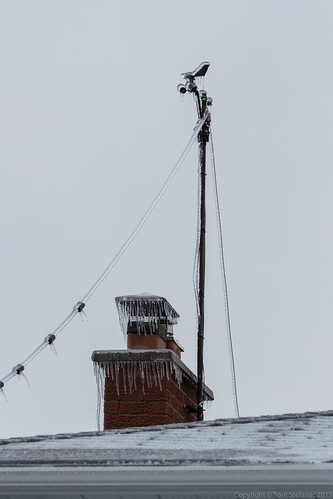
This explains why the wind speed was 0 and the direction was dead wrong. There were many public and private weather stations which were also full of erroneous wind data for the same reason.
This graphic shows when I lost wind data and also captures the time when I lost power Sunday morning. You can see the temperature in the house slowly drop down to 16C and hover there. I had my natural gas and wood fire places going to keep heat in the house which is why it levels off at 16C otherwise it would have kept falling.
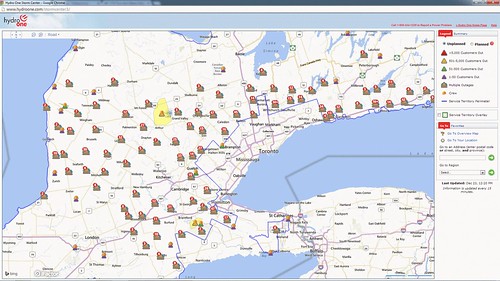
The power outage map was epic. I've never seen it this bad even after huge wind storms or severe weather in the summer.
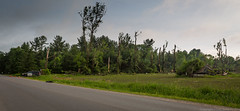
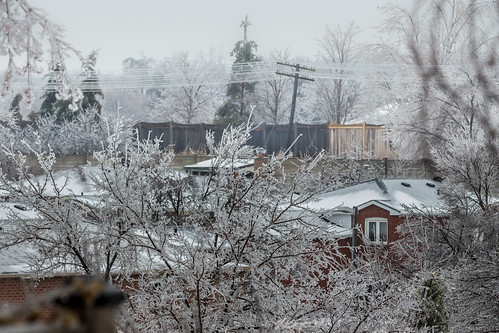
The telephoto lens here really compacts everything together.
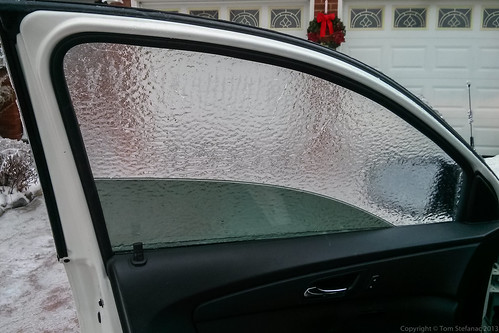
Finally! After an hour of chipping, chiseling and using my propane torch I somehow got into my truck. It was a miracle.
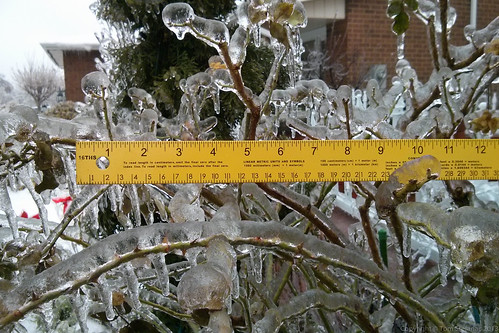
This gives some scope to the volume of ice that had accreted on surfaces.
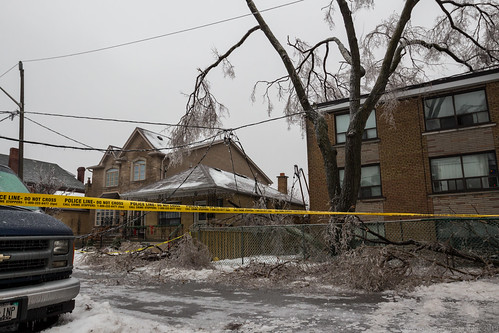
Unlike Vaughan, the suburb where I live, Toronto has the majority of its power infrastructure above ground. It was not until the late 60's and early 70's that putting power infrastructure underground became the normal practice. Most of Toronto had been built by then.
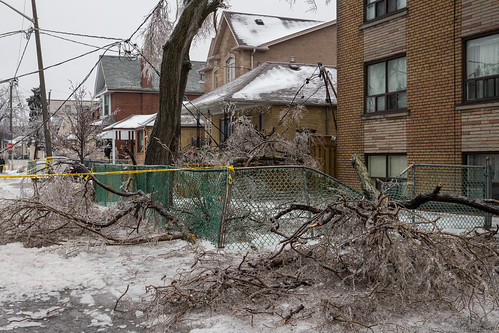
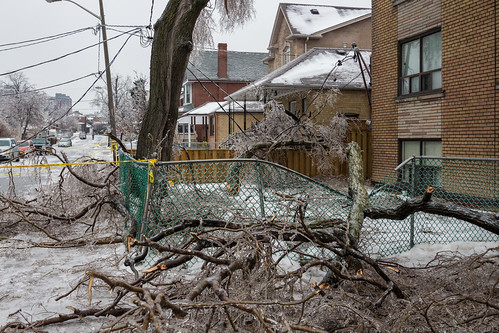
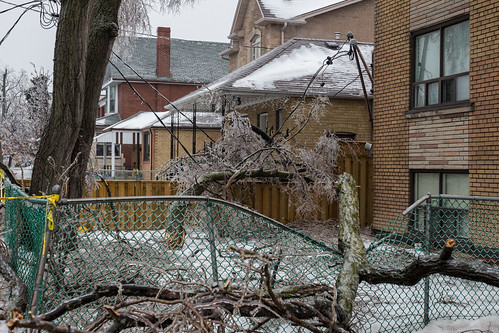
Here you can see the damage done to this residential line from the falling tree branch. The WHOLE city was like this, damage was everywhere.
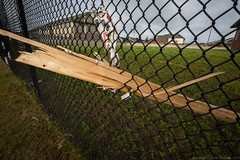
Look at the damage to the fence railing. That branch would kill anyone unfortunate enough to be struck.
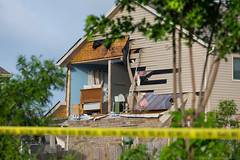
You can also see the local receptacle on the side of the building (right) has been all but torn off.