Posts in Category: 2015 Storm Chases


September 9th 2015
 Not a storm chase per say. While on vacation in Florida this tropical thunderstorm about 70km away lit up the horizon with awesome lightning!


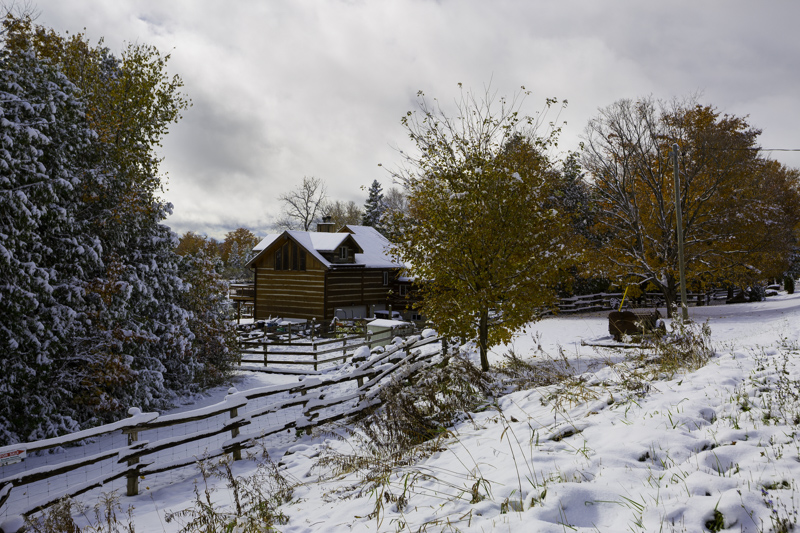
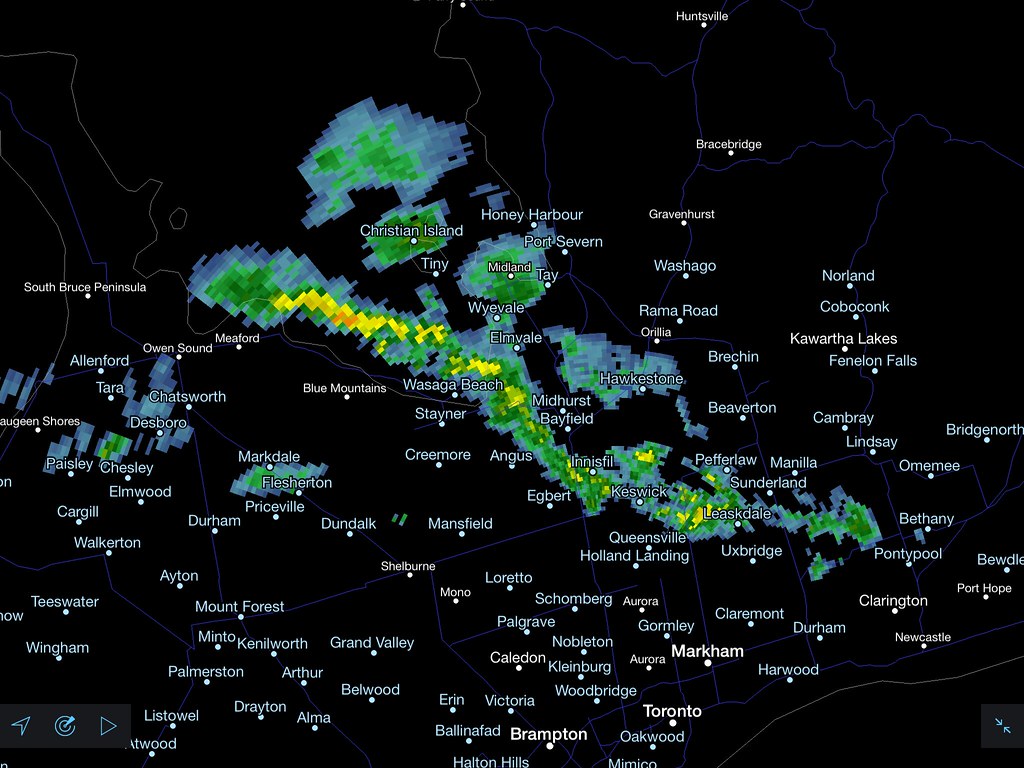
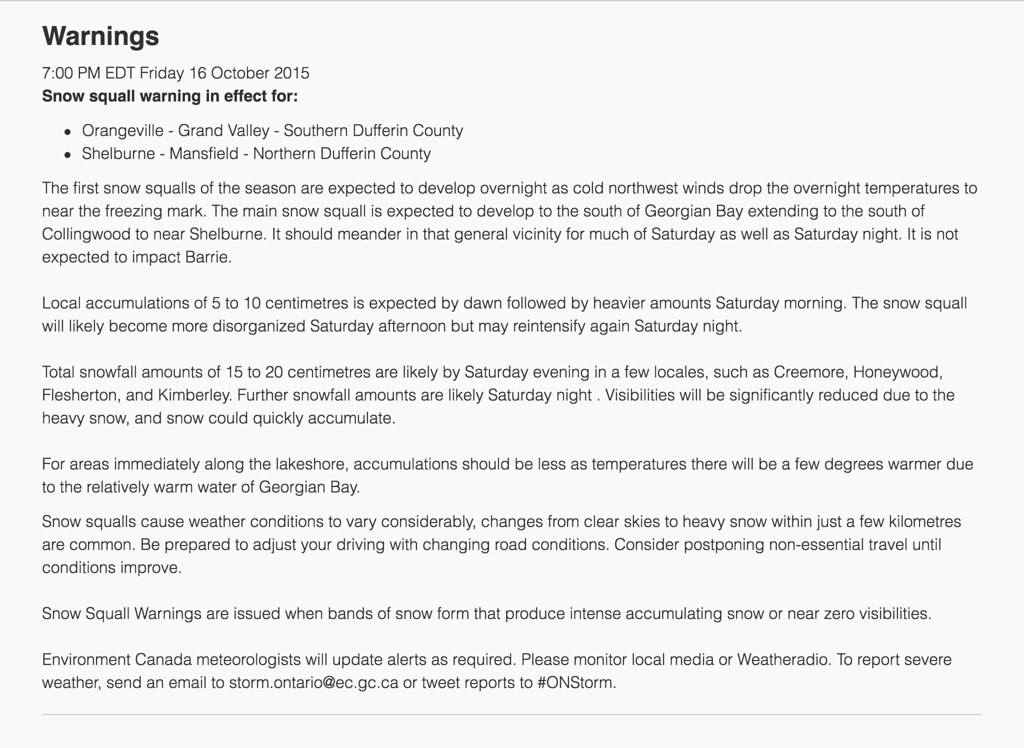
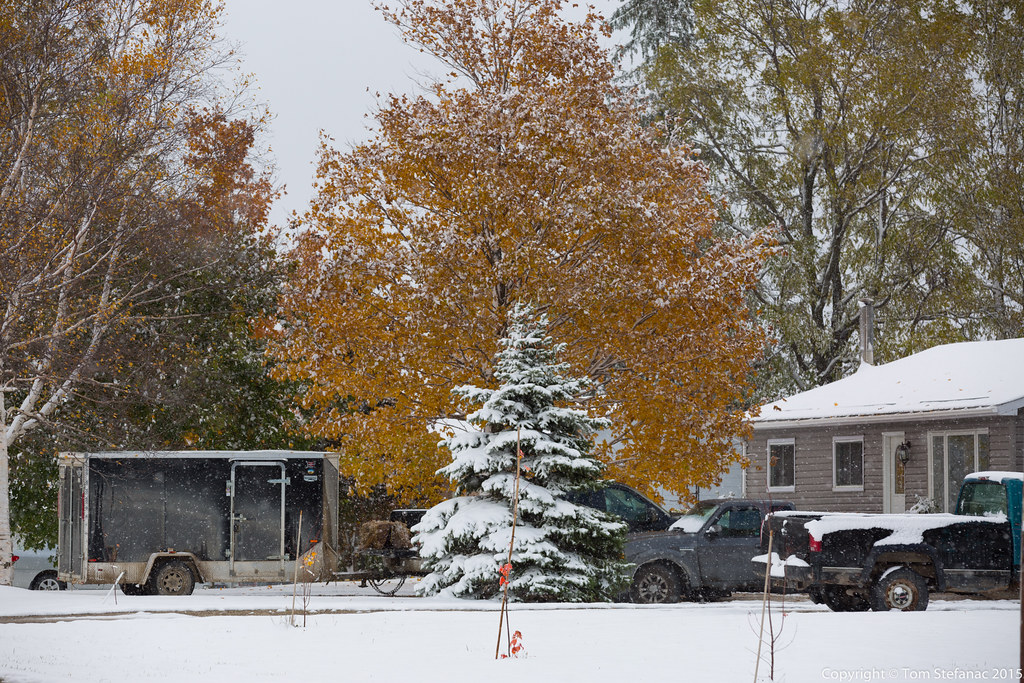
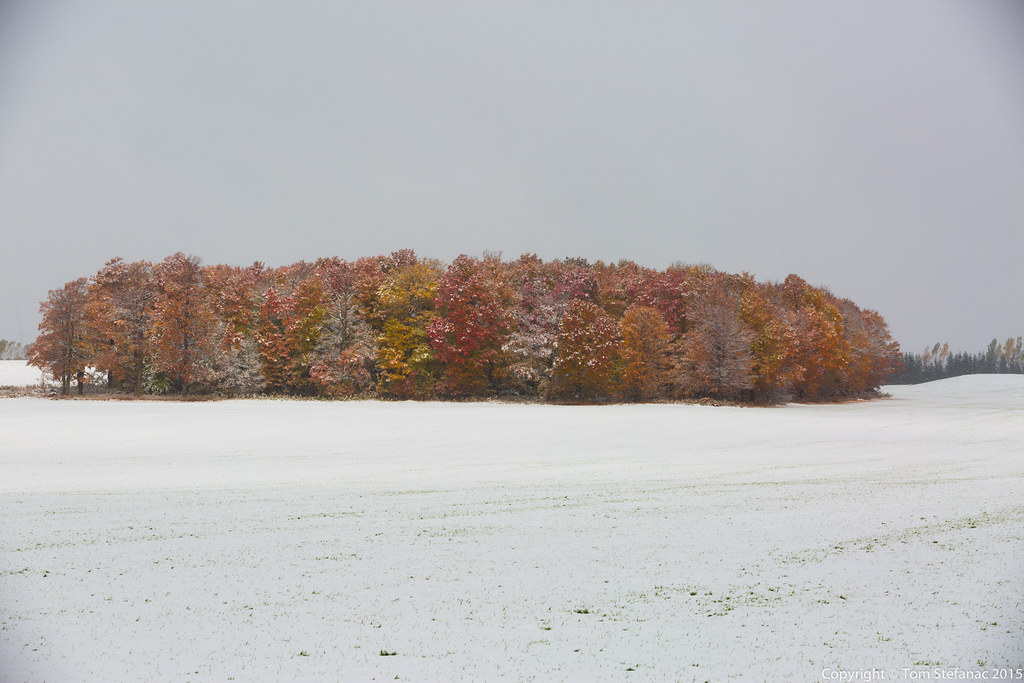
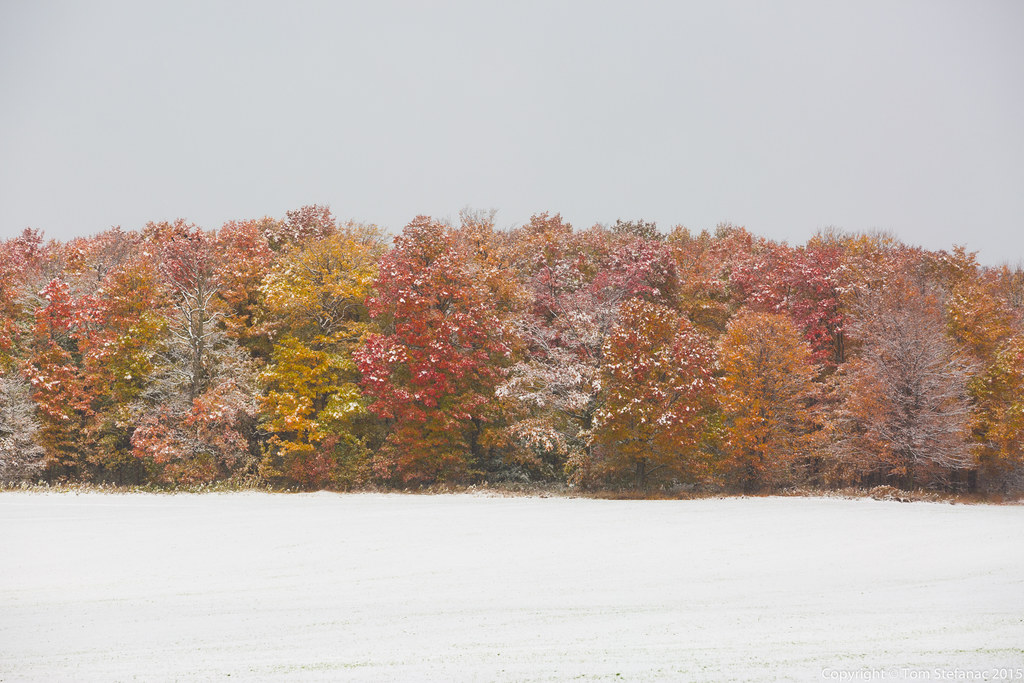
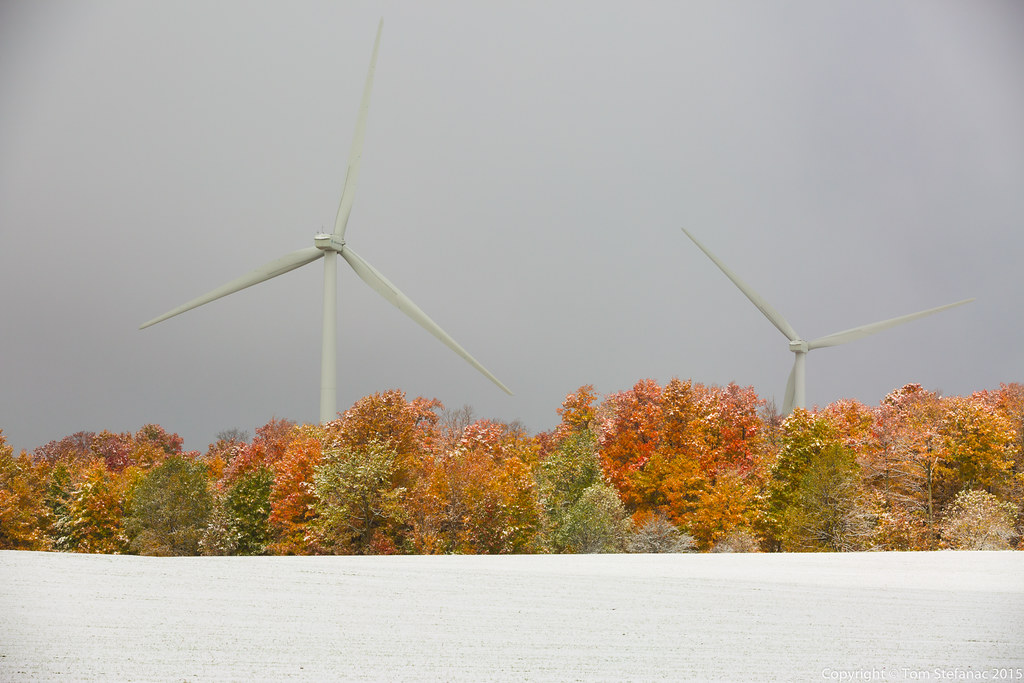
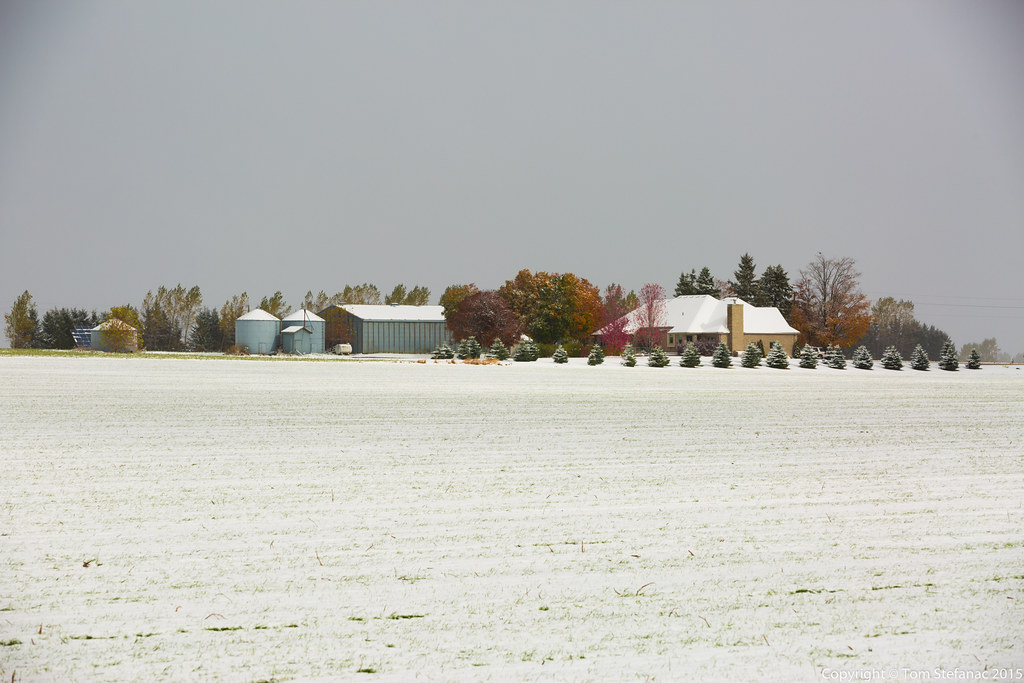
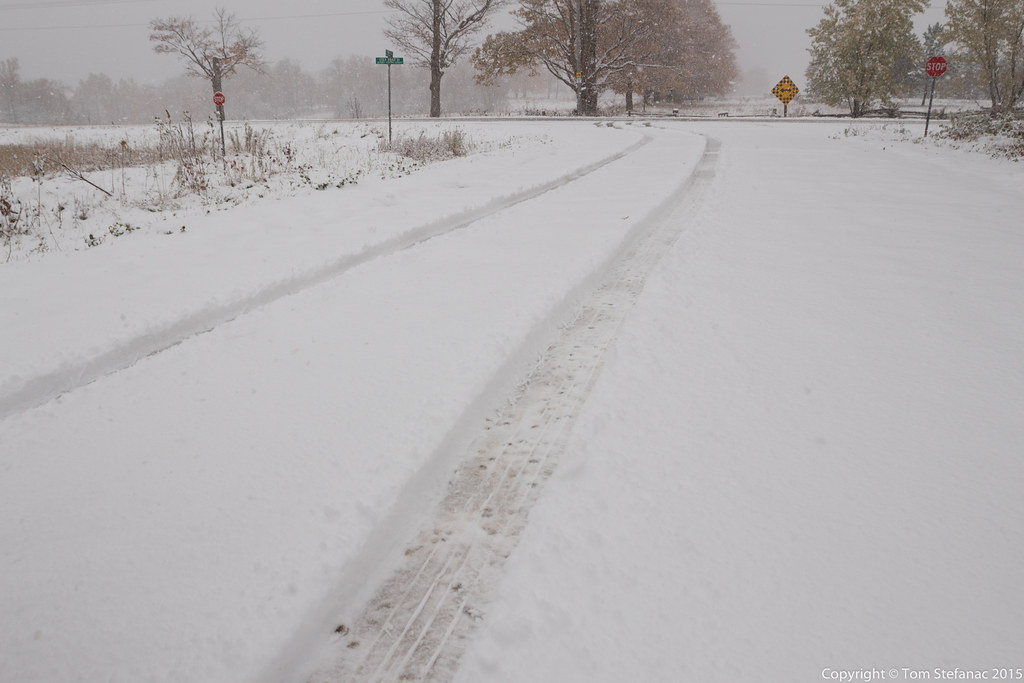
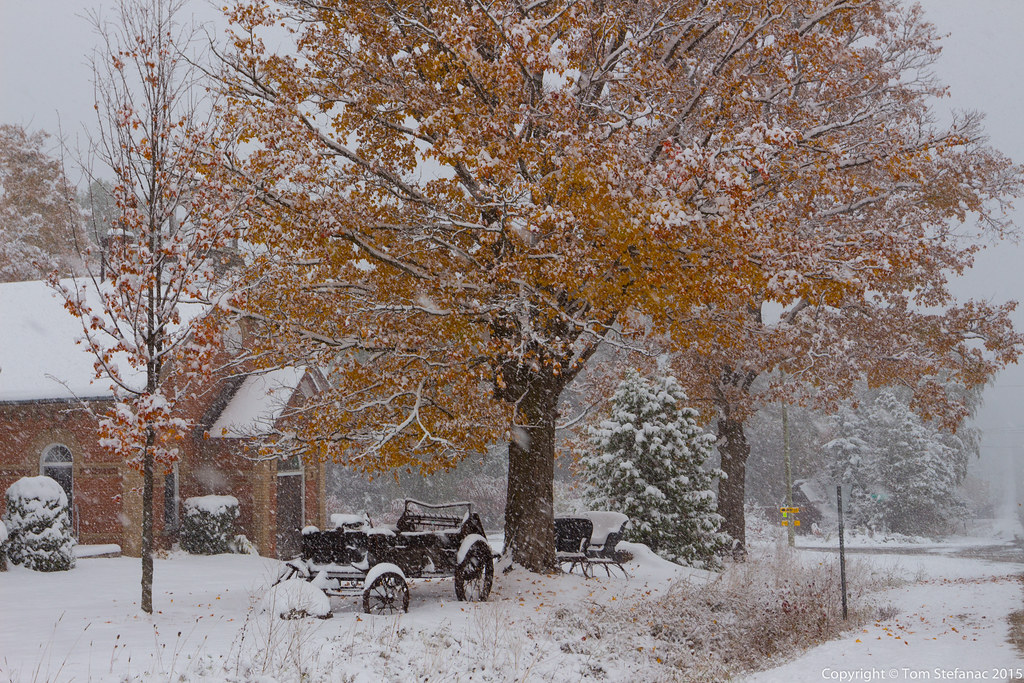
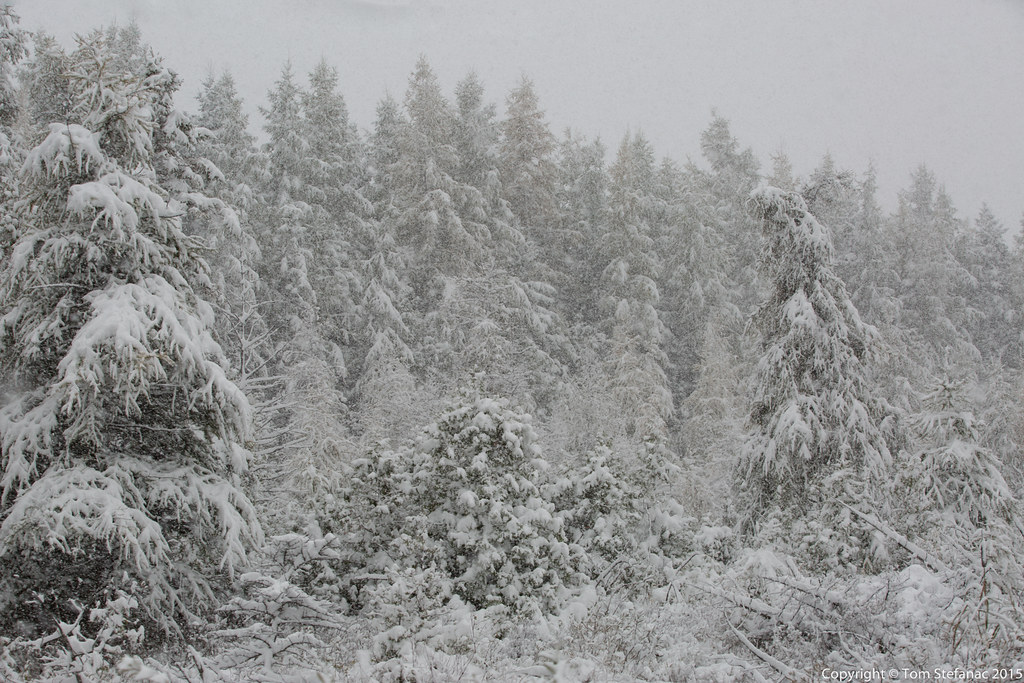
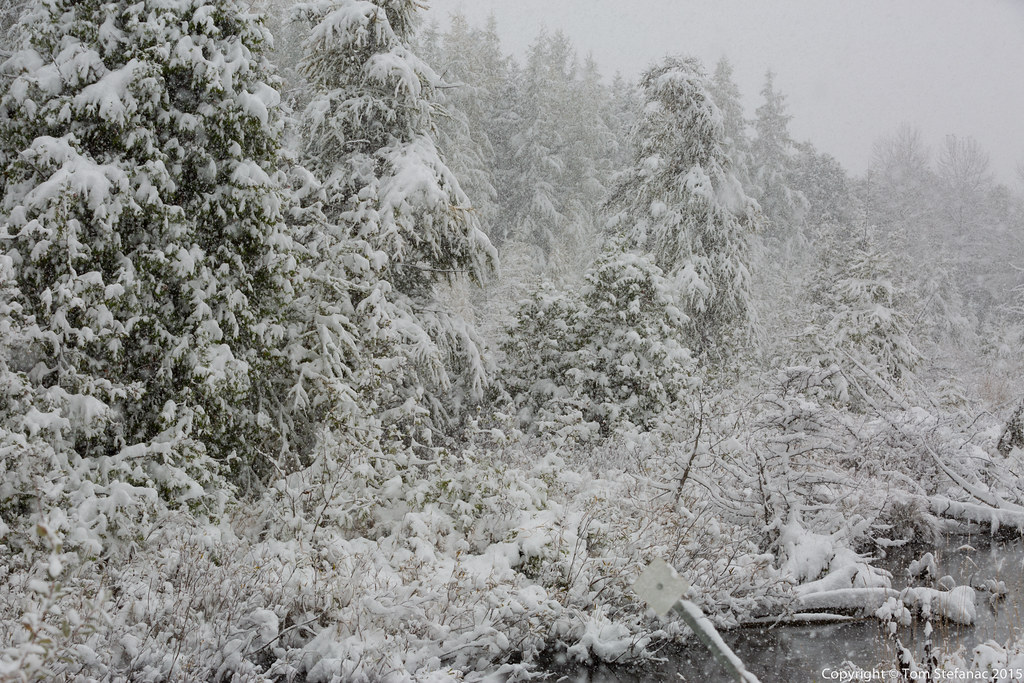
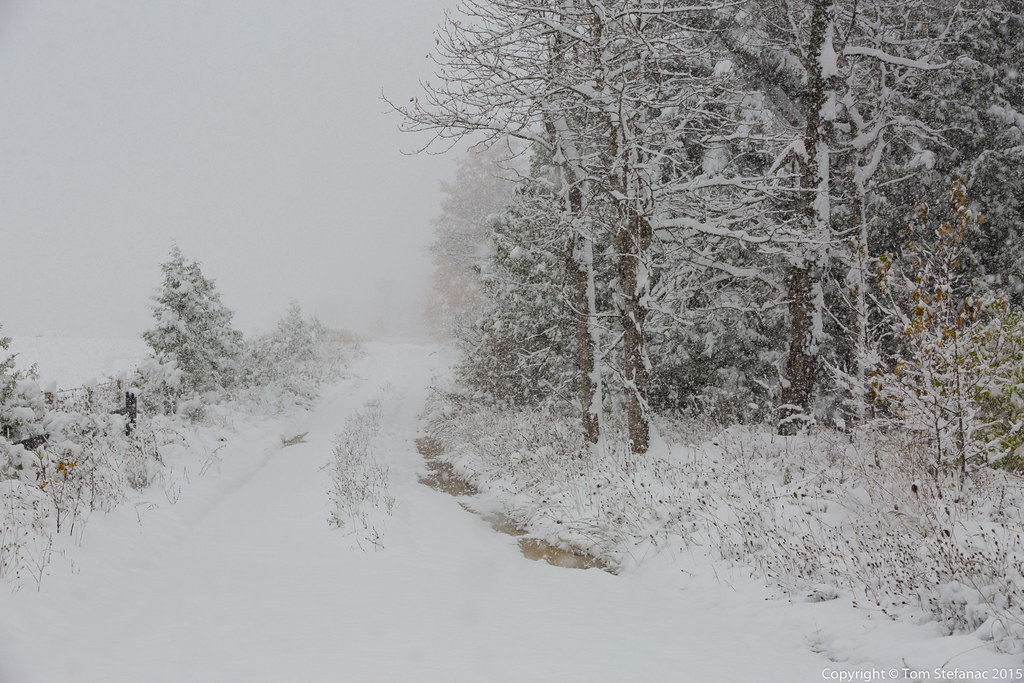
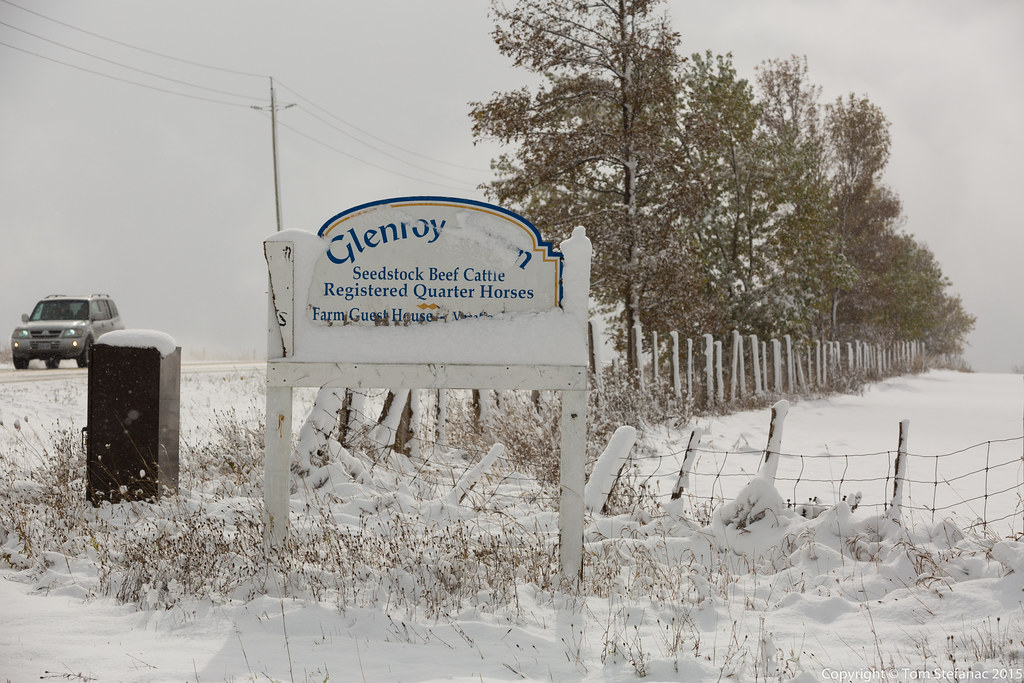
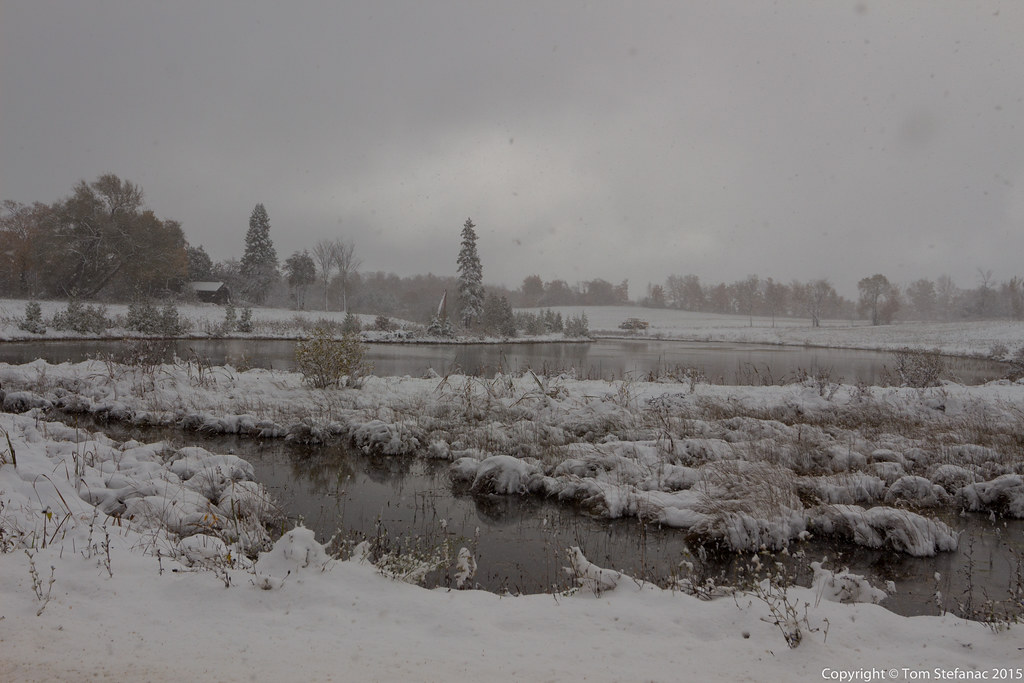
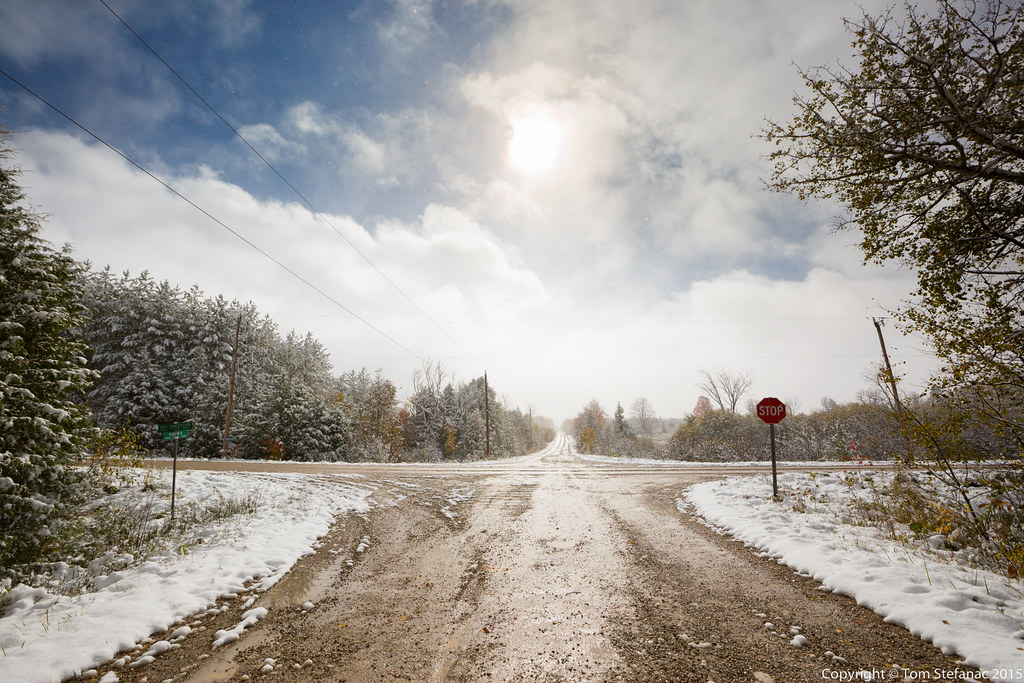
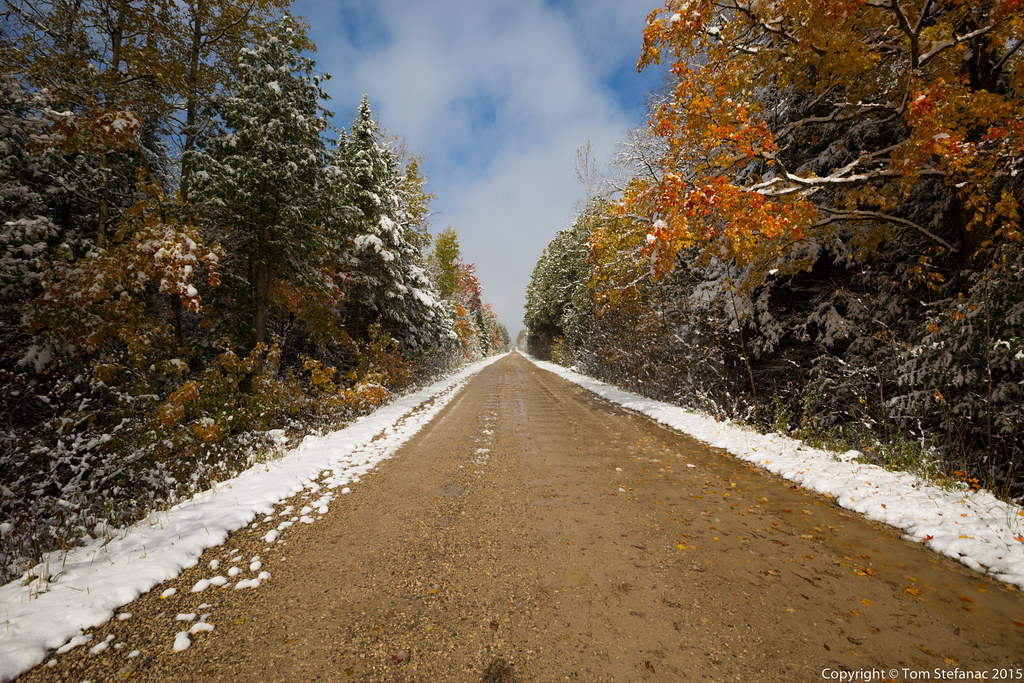
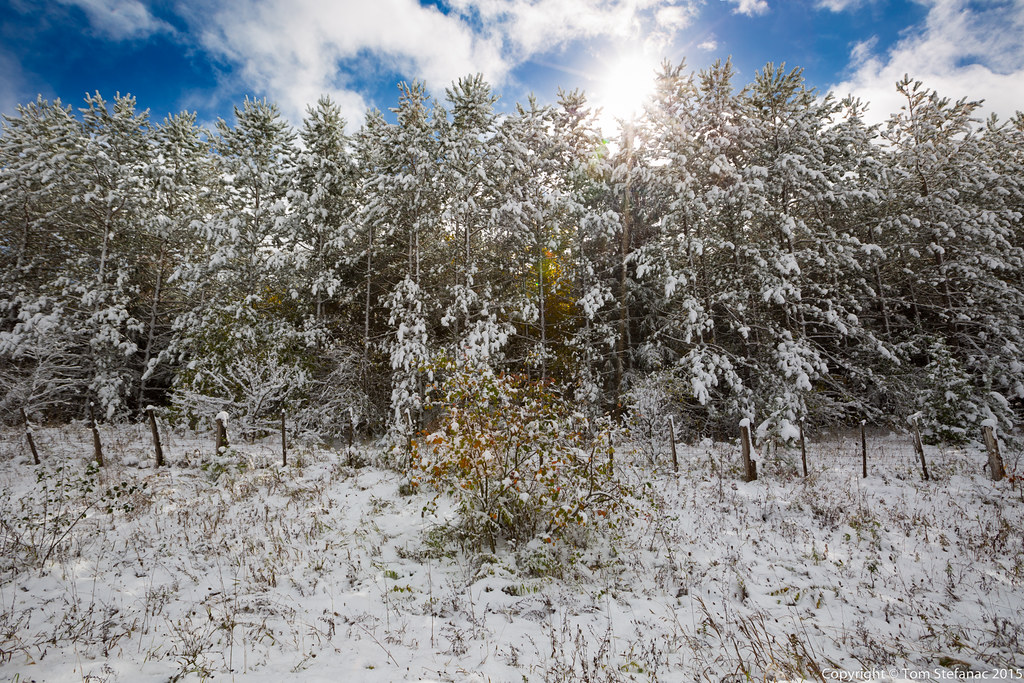
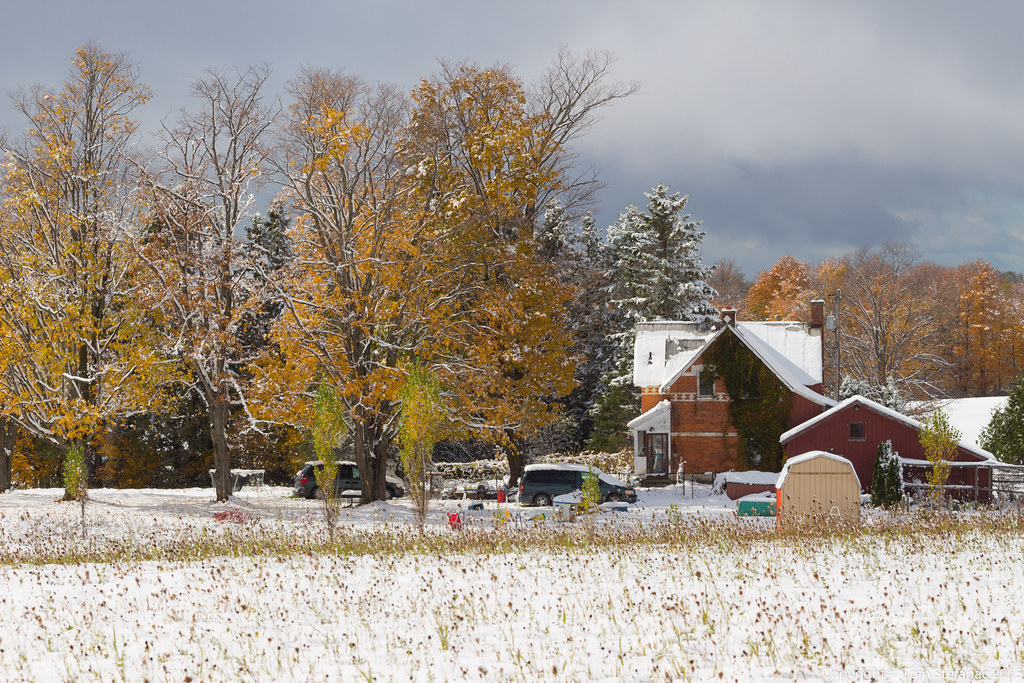
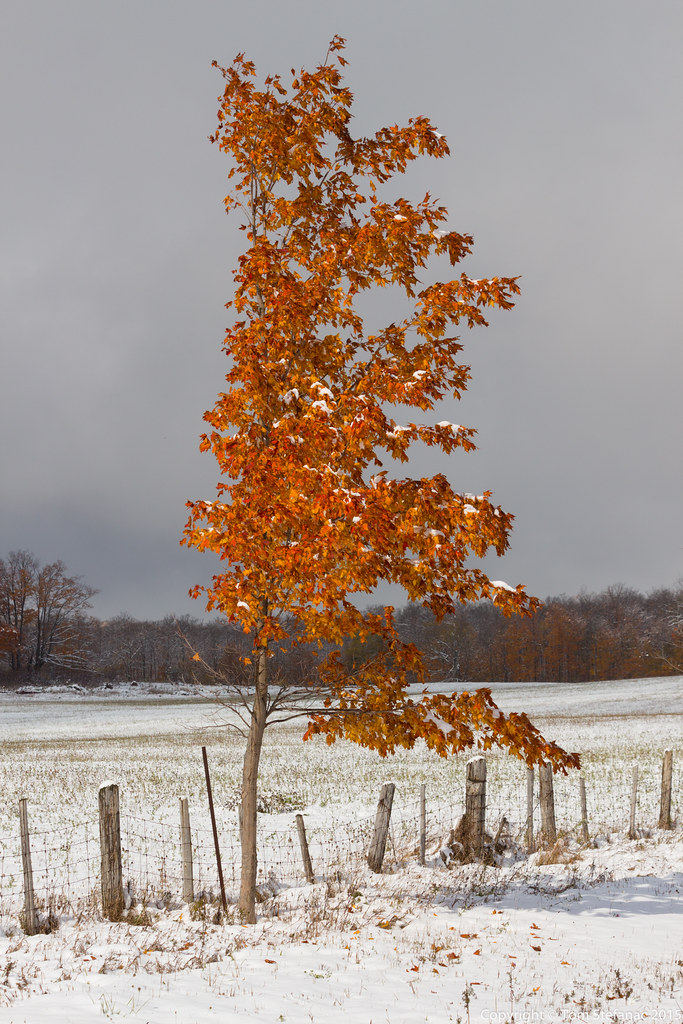
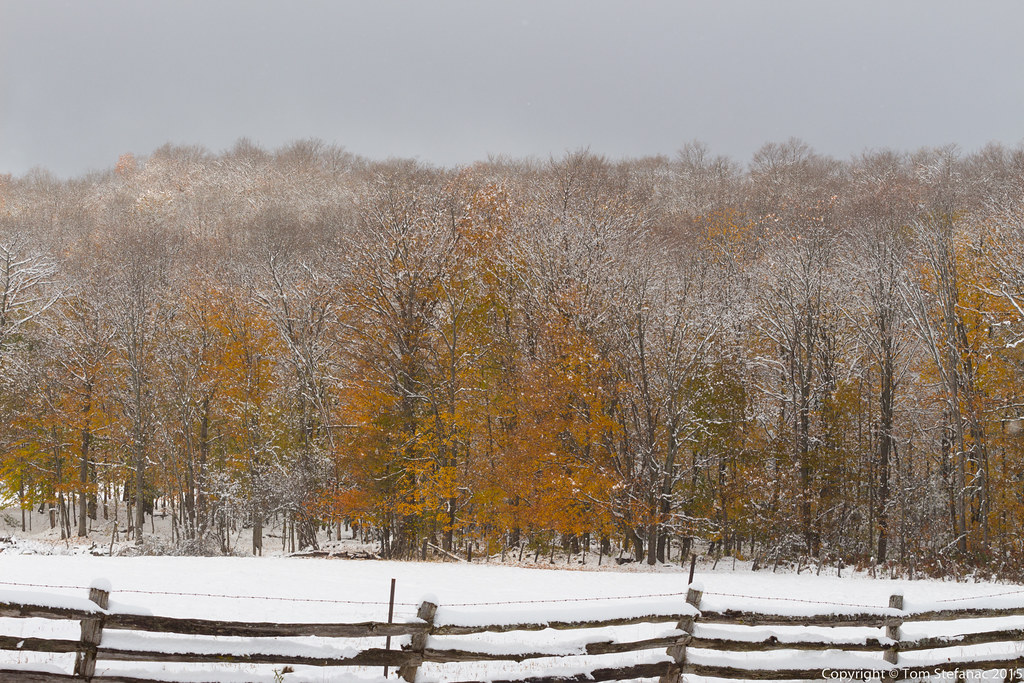
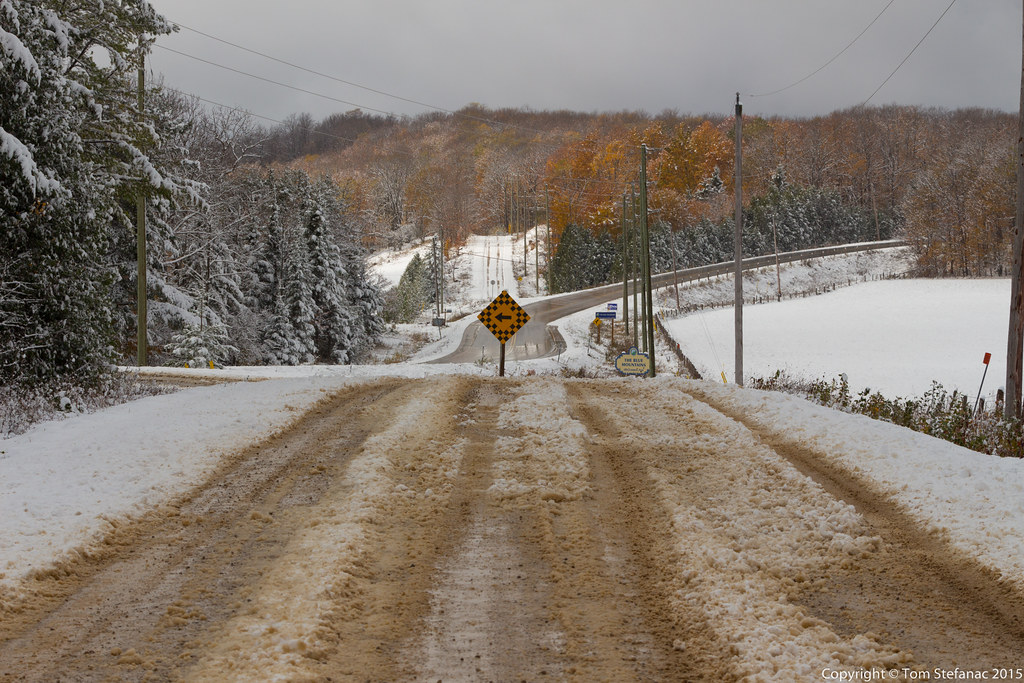
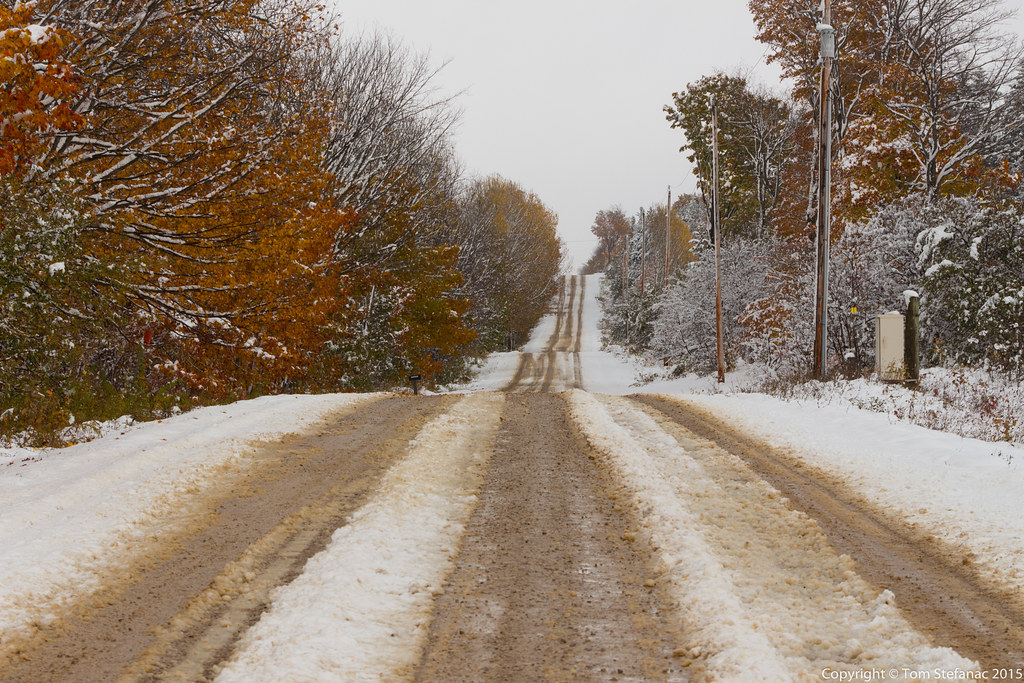
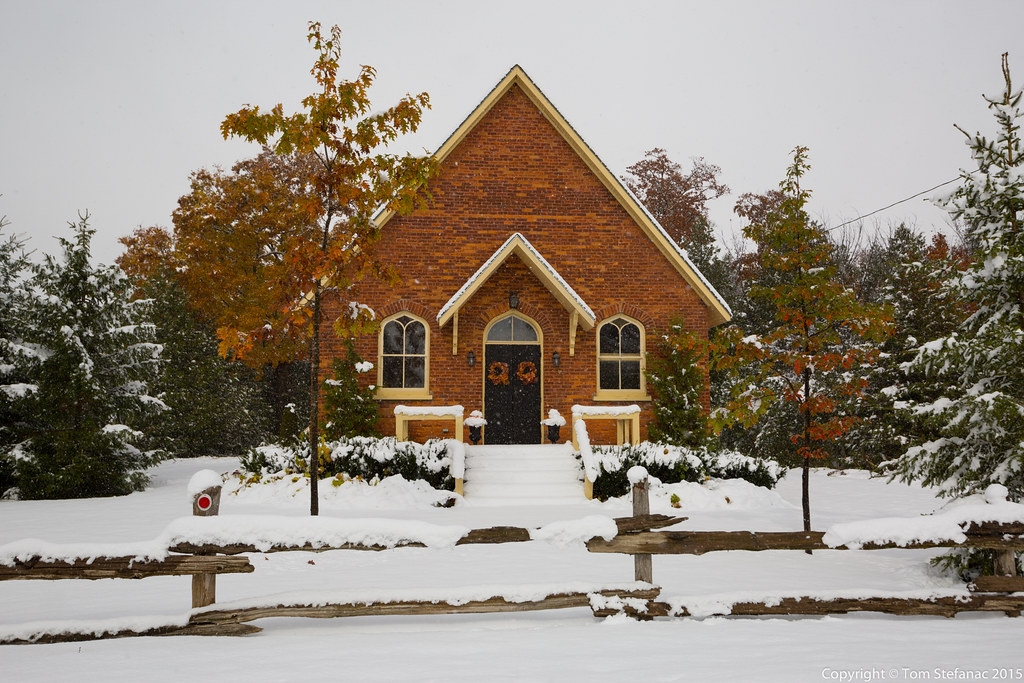
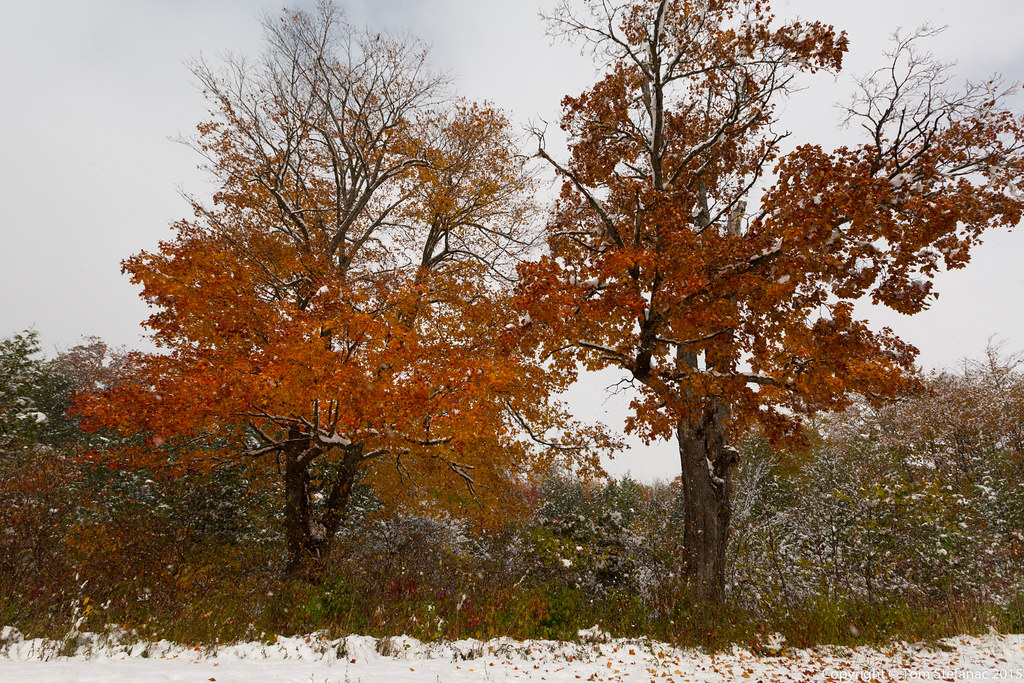
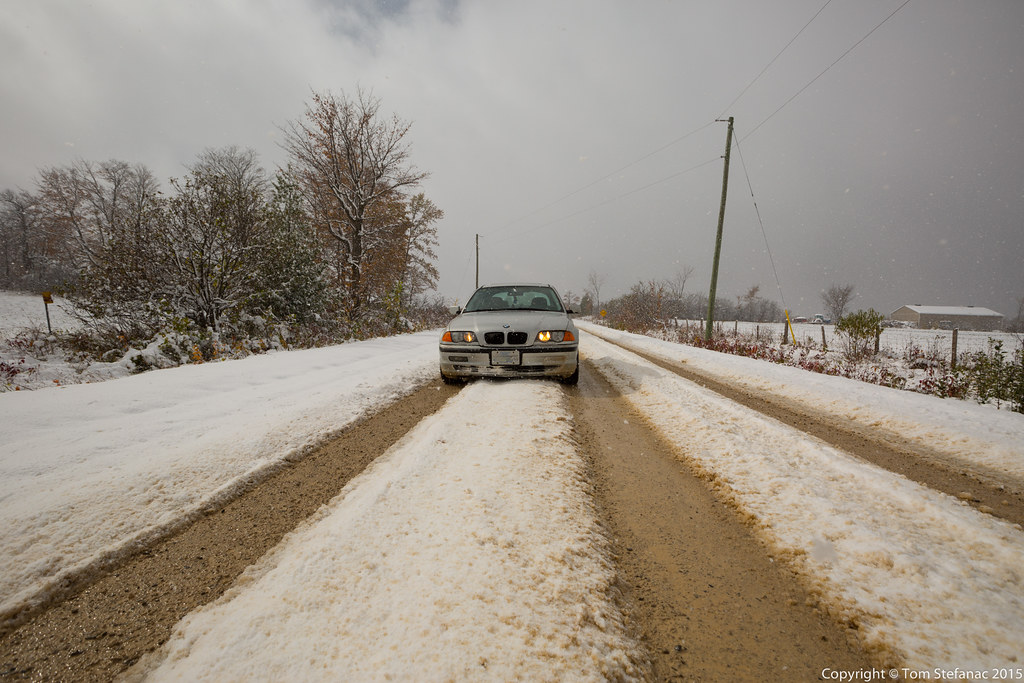
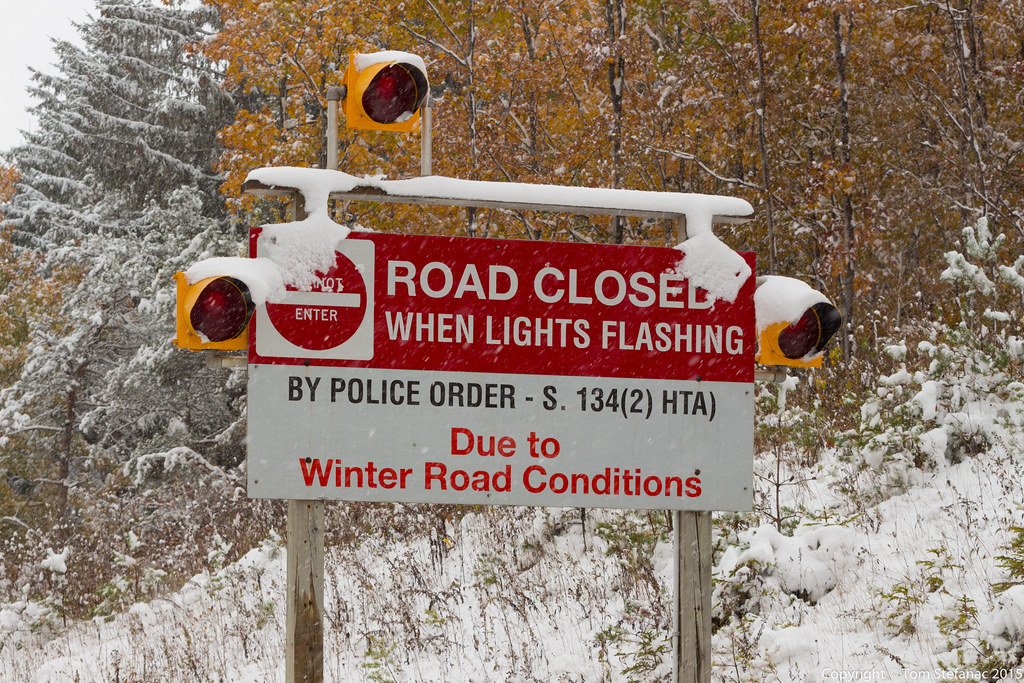
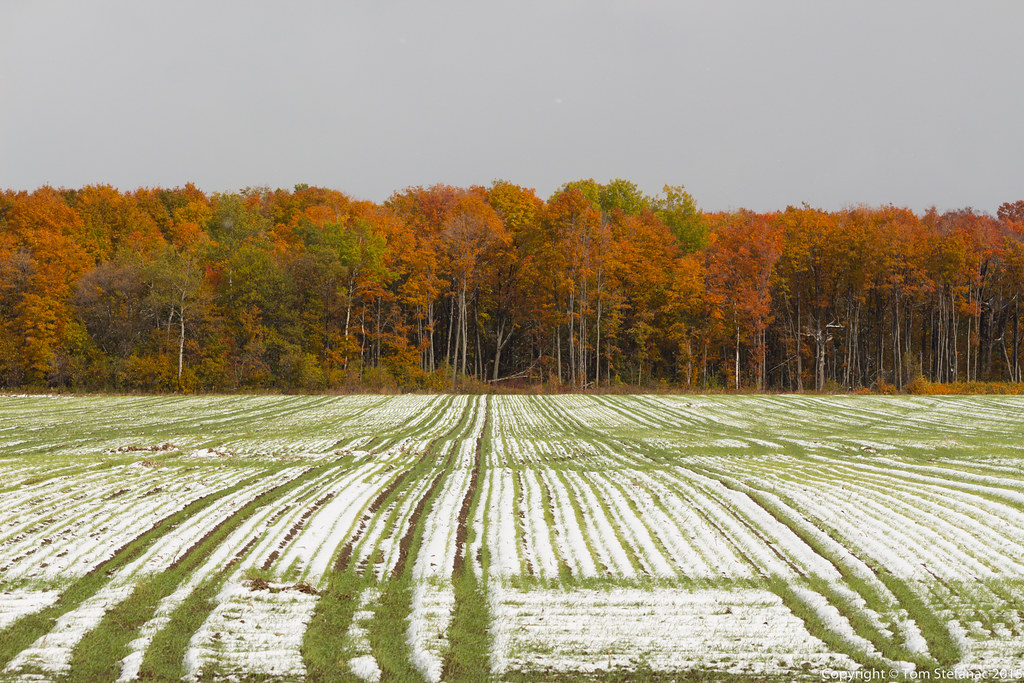
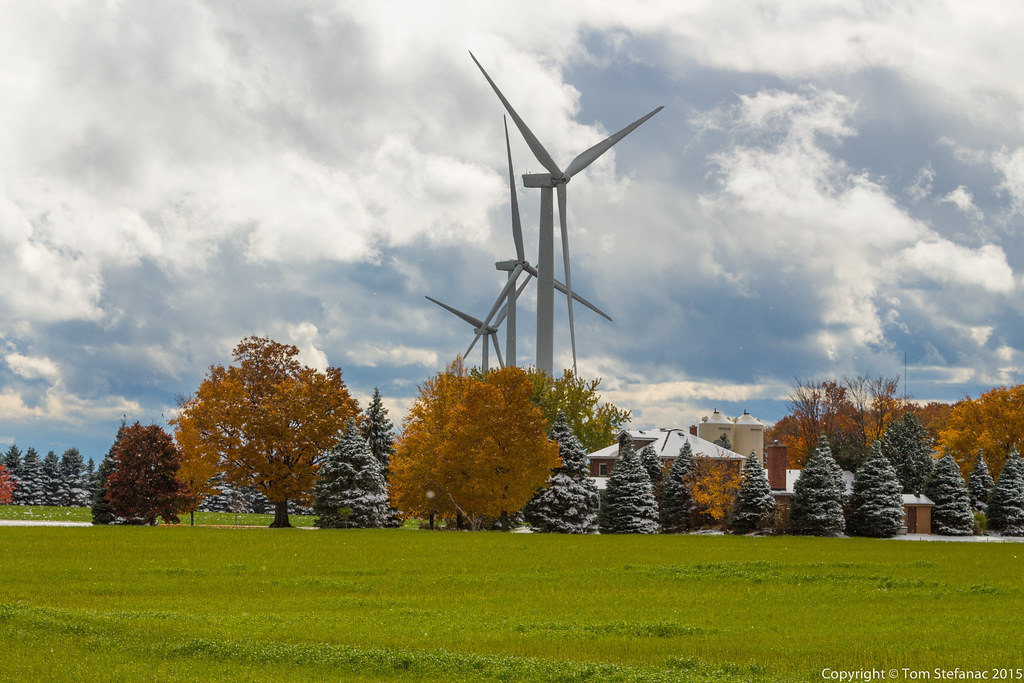
October 17th 2015


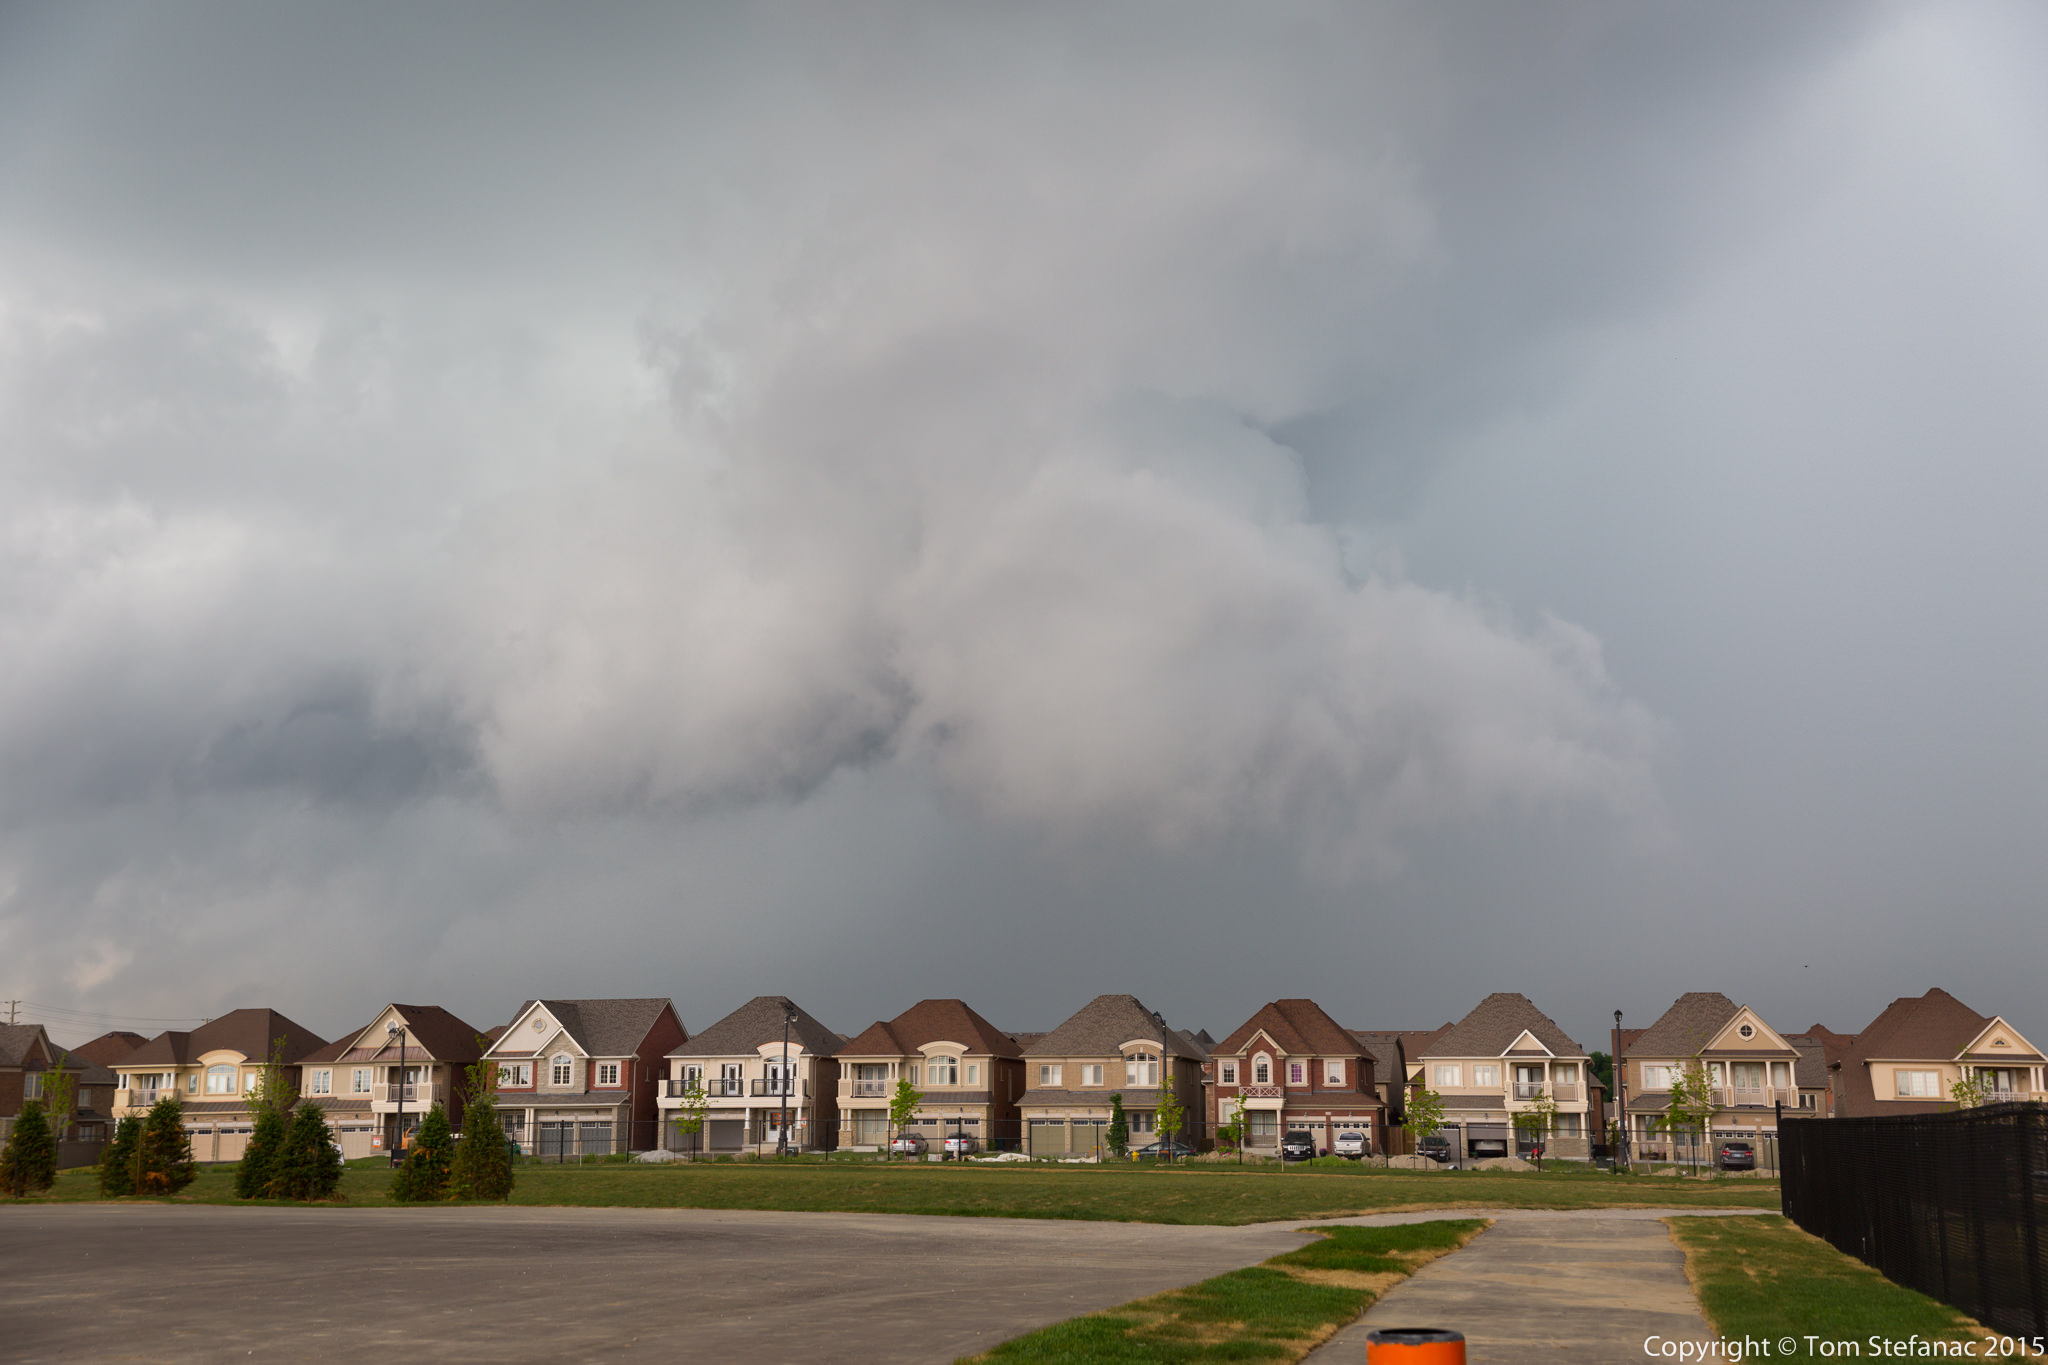
June 27th 2015
This was a very unusual weather patter for late June. Basically, a low pressure system amplified by a neutral trof developed over southern Illinois and quickly deepened when an MCS formed with the center of the low and fed back energy. The low pressure system then quickly tracked north-east from Indiana and occluded as it reach Southern Ontario. Despite the occlusion occuring, there was enormous low level wind energy and weak instability which allowed the system to continually fill with rain and weak embedded storms all in addition to remnant moisture from the pre-existing MCS.

Despite this being a synoptic system that really just made for a miserable and cool weekend, I somehow decided that it would be a good idea to head down to the Lake Ontario shoreline. It was actually very tropical storm like with constant winds and rain bands battering the shore and his actually created some interesting weather.


June 25th 2015


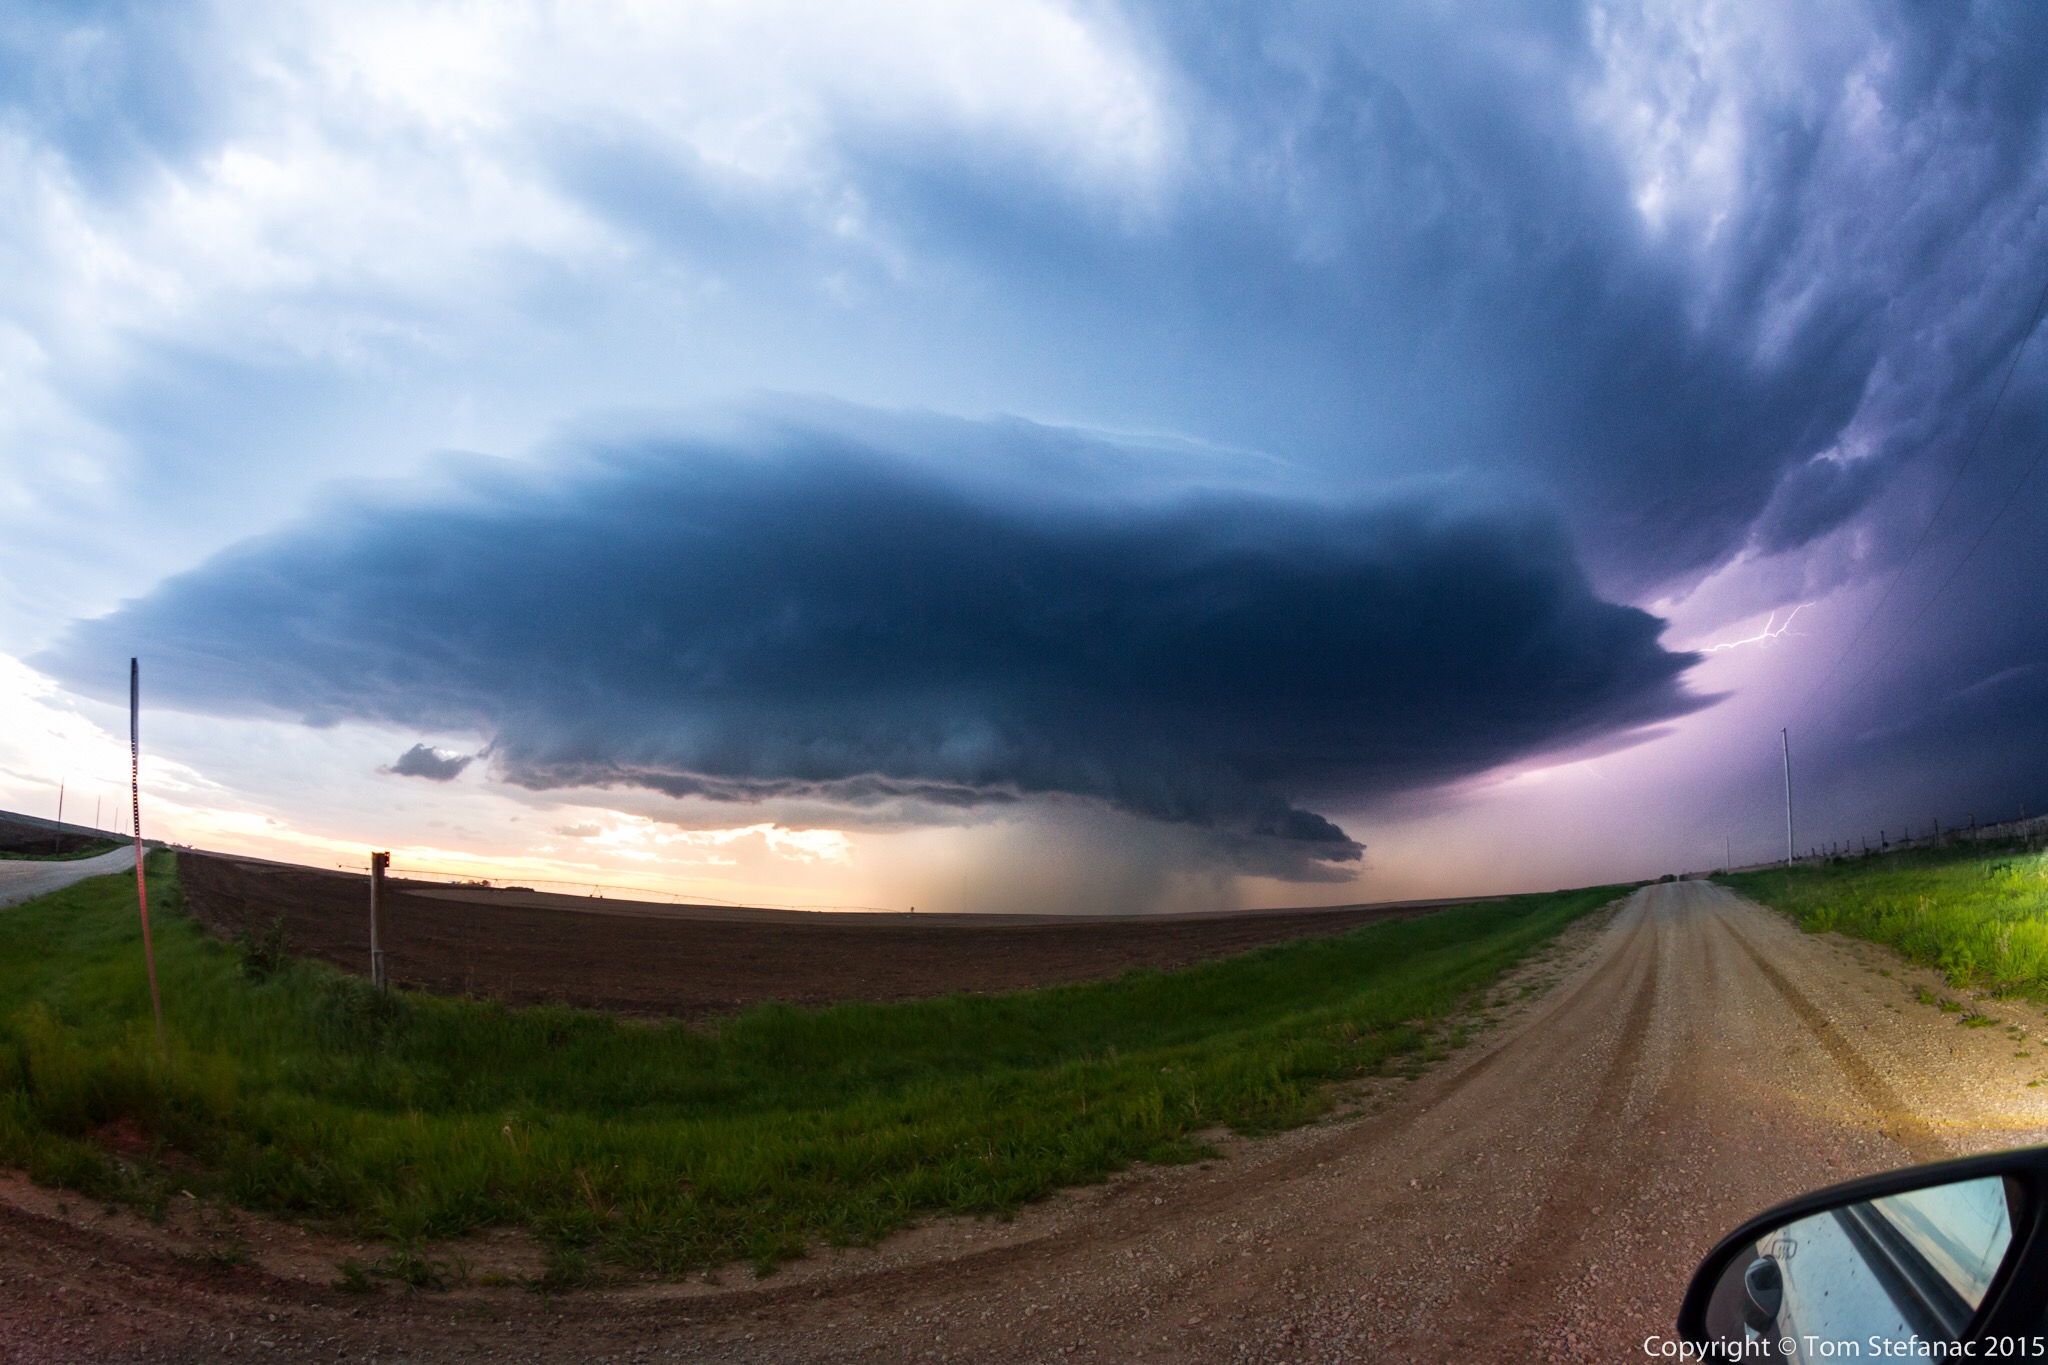
Here are a couple GIF loops showing the storm and the associated velocity couplet. You’ll also find a time-lapse video at the bottom showing the supercell mesocyclone and associated wall cloud in motion with clear rotation.
June 8th 2015
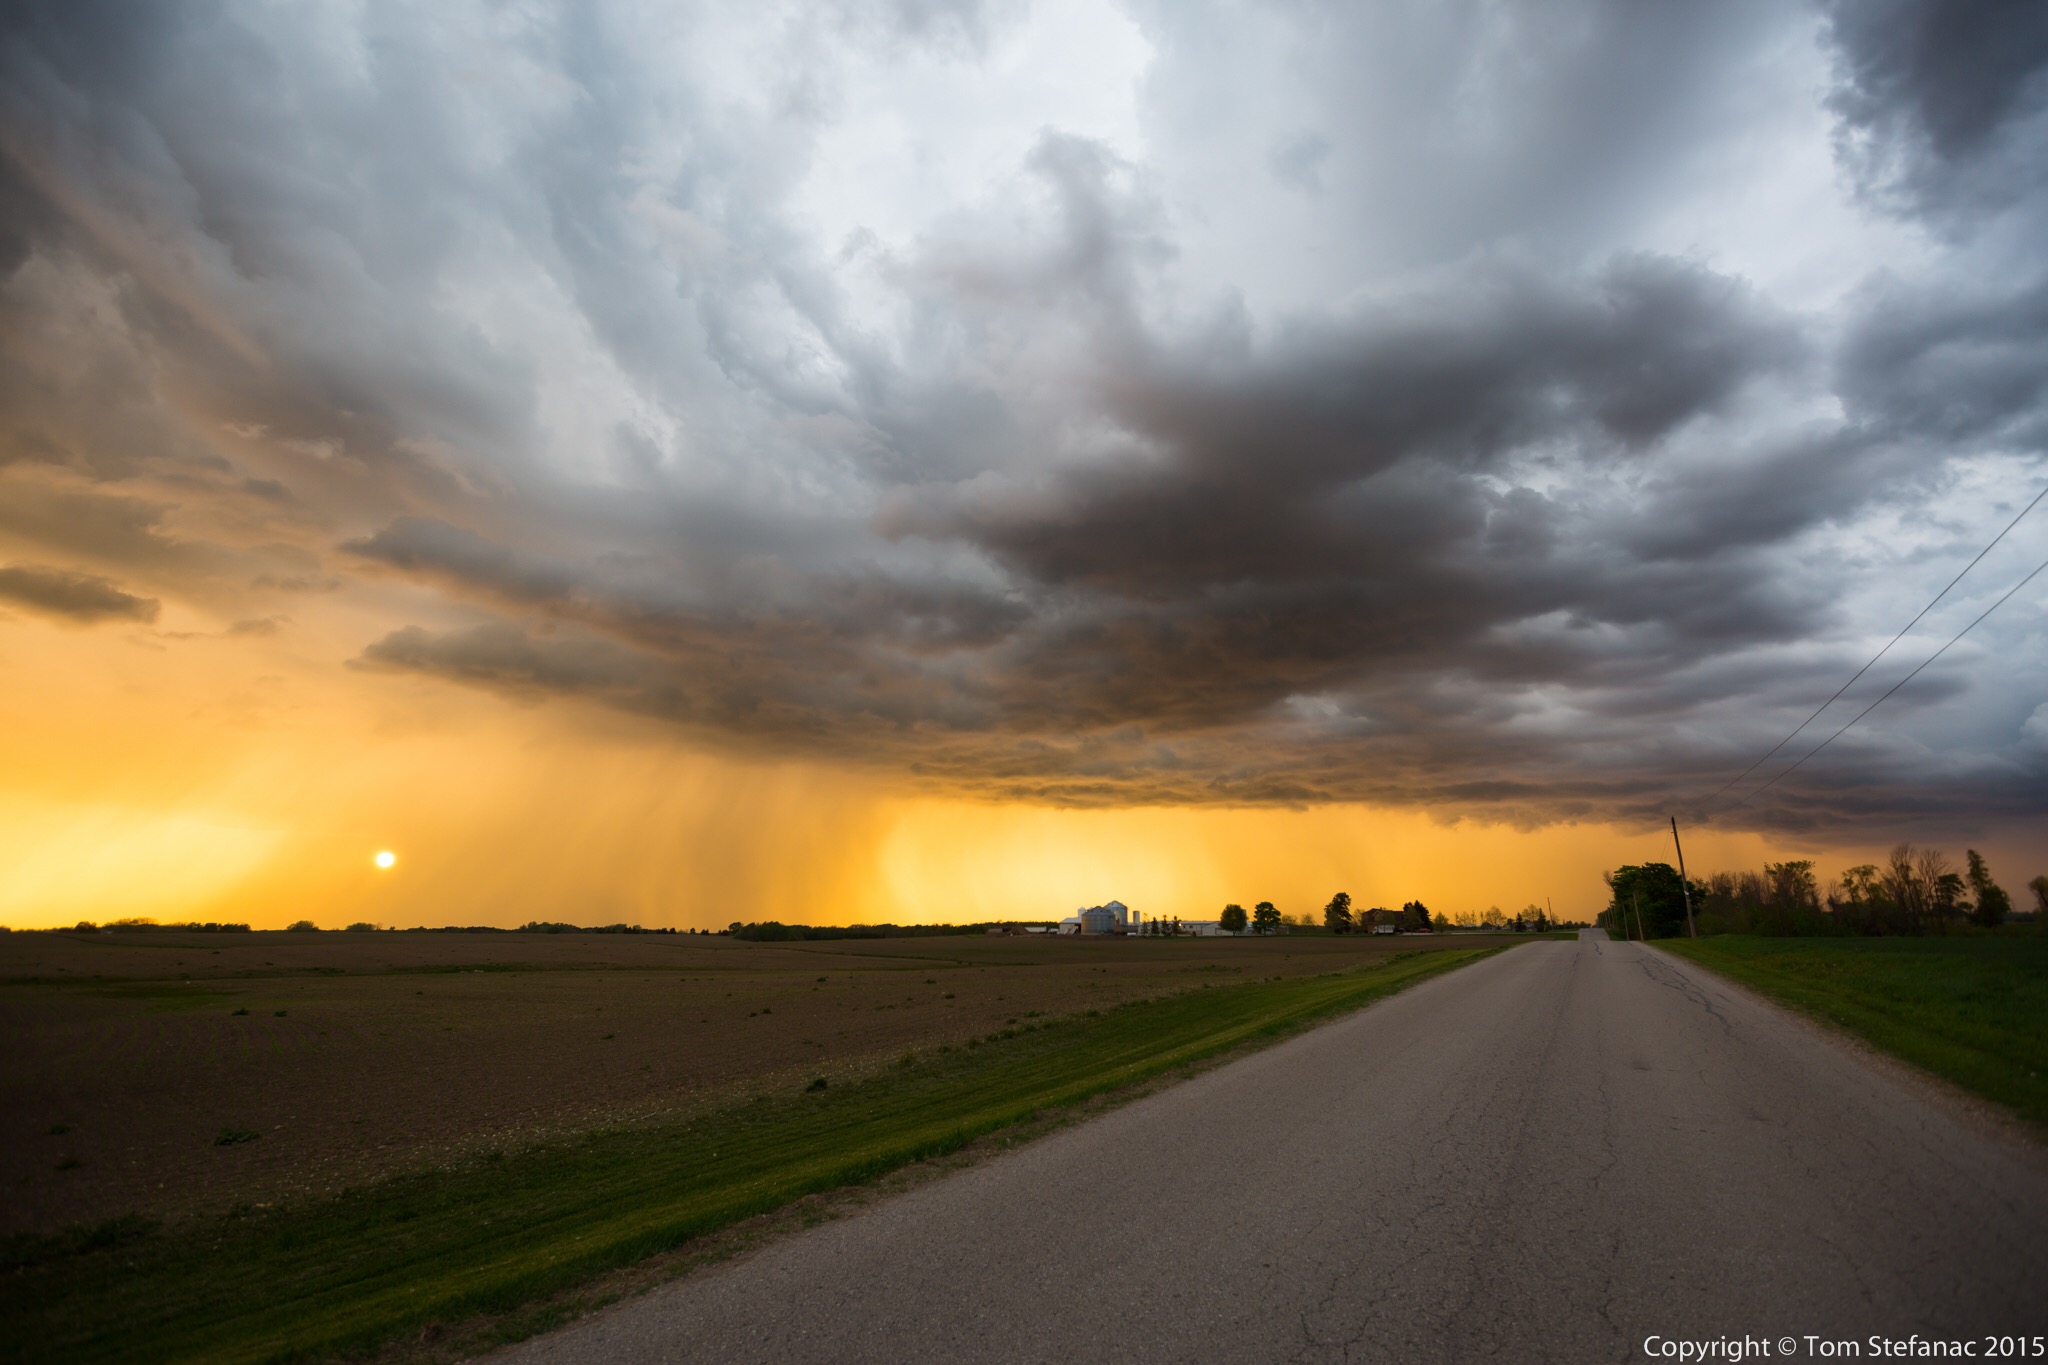
This was one of those somewhat unusual setups where storms were poised to fire along a trough from a secondary low behind a weak cold front. The initial cold front brought weak storms and drenching rains overnight and into the morning.


April 30th 2015
This was the real start of my chase-cation. There was a very marginal potential for severe storms and tornadoes were a virtual impossibility based on probabilities. It was a usual weird as could be high plains setup where by some miracle of the storm relative wind fields and near non existent moisture, the high plains would somehow produce storms which would grow in strength by evening and eventually everything would be pushed out by a cold front sinking south from Wyoming. Weird things happen above 1500 meters in elevation!


May 11th 2015
On this day a messy warm front which was severely stunted by the cold water of the great lakes struggled to make it into Southern Ontario. Shear profiles supported a linear squall line at best along a trof line and energy was very weak with peak cape around 800 j/kg.


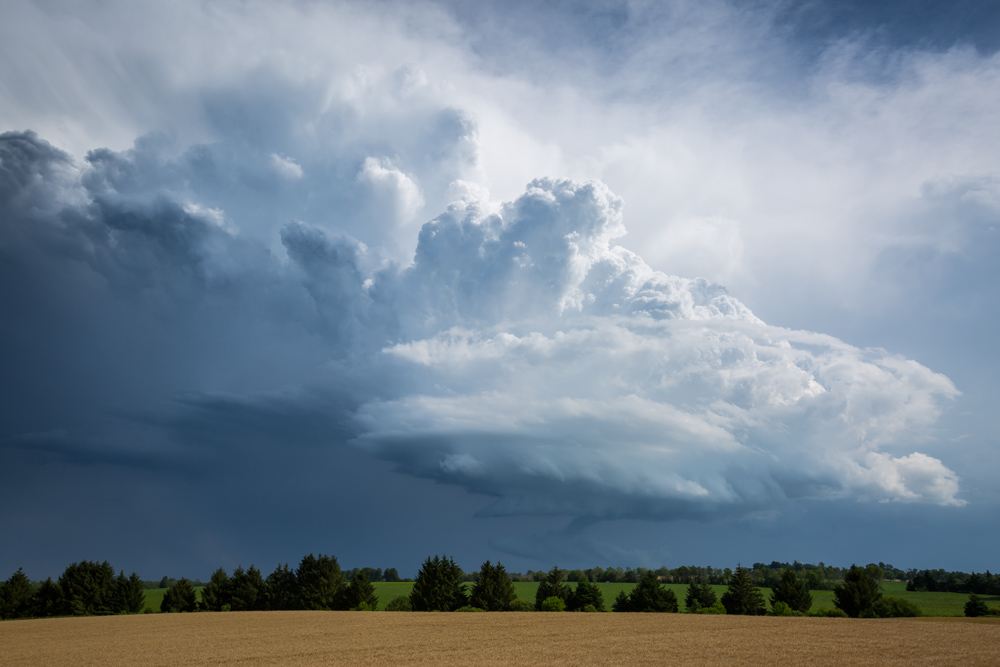
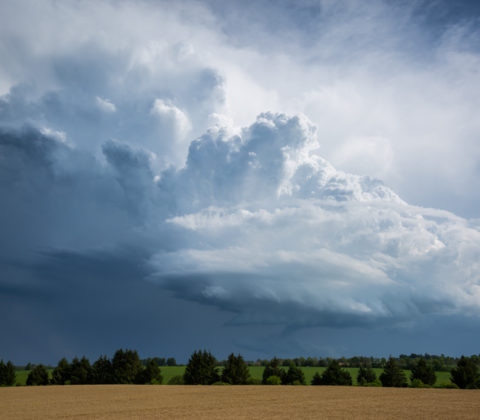
May 30th 2015
The models two days prior had already indicated that today was going to be a long chase day with a slow moving cold front and pre-frontal trough sparking off convection as it crept into a warm southwesterly wind field. By 11AM storms had already started to quickly form and by midday the action was in full swing.


May 18th 2015
Today was the first “real” Southern Ontario chase that presented any possibility of actual thunderstorms. Having gotten back from tornado alley I was not storm deprived but I was not expecting much either. After chasing down in the alley, Southern Ontario can be pretty boring. I usually don’t feel the storm vibe here until late June or early July when SDS (storm deficite syndrome) begisn to set in again.
The play was going to be along a cold front swooping in from Michigan. There were indications that there could have been some storms earlier in the day around 18Z/2PM along a pre-frontal trough however mid level subsidence crushed everything. I spent a few hours at the Cambridge Onroute service centre. Things inititally looked somewhat promising but then the cu field quickly began to show signs it was just turning into pancake cloud. Pancake cumulus is a term often used by pilots to describe cumulus that hit an inversion and stop growing vertically but instead flatten out and turn into stratus, from the air they look like pancakes apparently.
Again, the only area of pre-frontal convergence was right between the lake breeze boundaries just west of Hamilton and you can see how the clouds are flattening out and not growing any taller. They were all hitting this nasty 600mb inversion and it was just halting their development.


May 3rd 2015
Today was the first real chase day that showed some potential for severe storms. A thermal trof was swinging in from the west and coupling itself with a cold front descending from North Dakota into Eastern Nebraska. The best lapse rates were right on the nose of warm air where there was a southeasterly wind field. The biggest problem at the time was a lack of good 500mb support but otherwise bulk shear numbers were set to rise as the day progressed.
HPC surface analysis 21Z May 3rd 2015


April 2nd 2015 – BUST


March 1st 2015 – Record Cold February
I’m not a climatologist and I was not around in the late the 70’s but according to the record books, this past February was certainly something record breaking to live through and challenged the February’s of 1977 through 1979.
December was relatively warm, at least compared with last year! The mean temperature was a balmy 0.0C with the coldest temperature of -10.3C having been recorded on the 2nd and the warmest high of 10.1C on the 24th. By January more polar air was making it’s way south and the mean temperature plummeted to -7.3C with the first sub -20C low being reported on the 13th when the mercury dipped to -21.4C at 7:34AM.
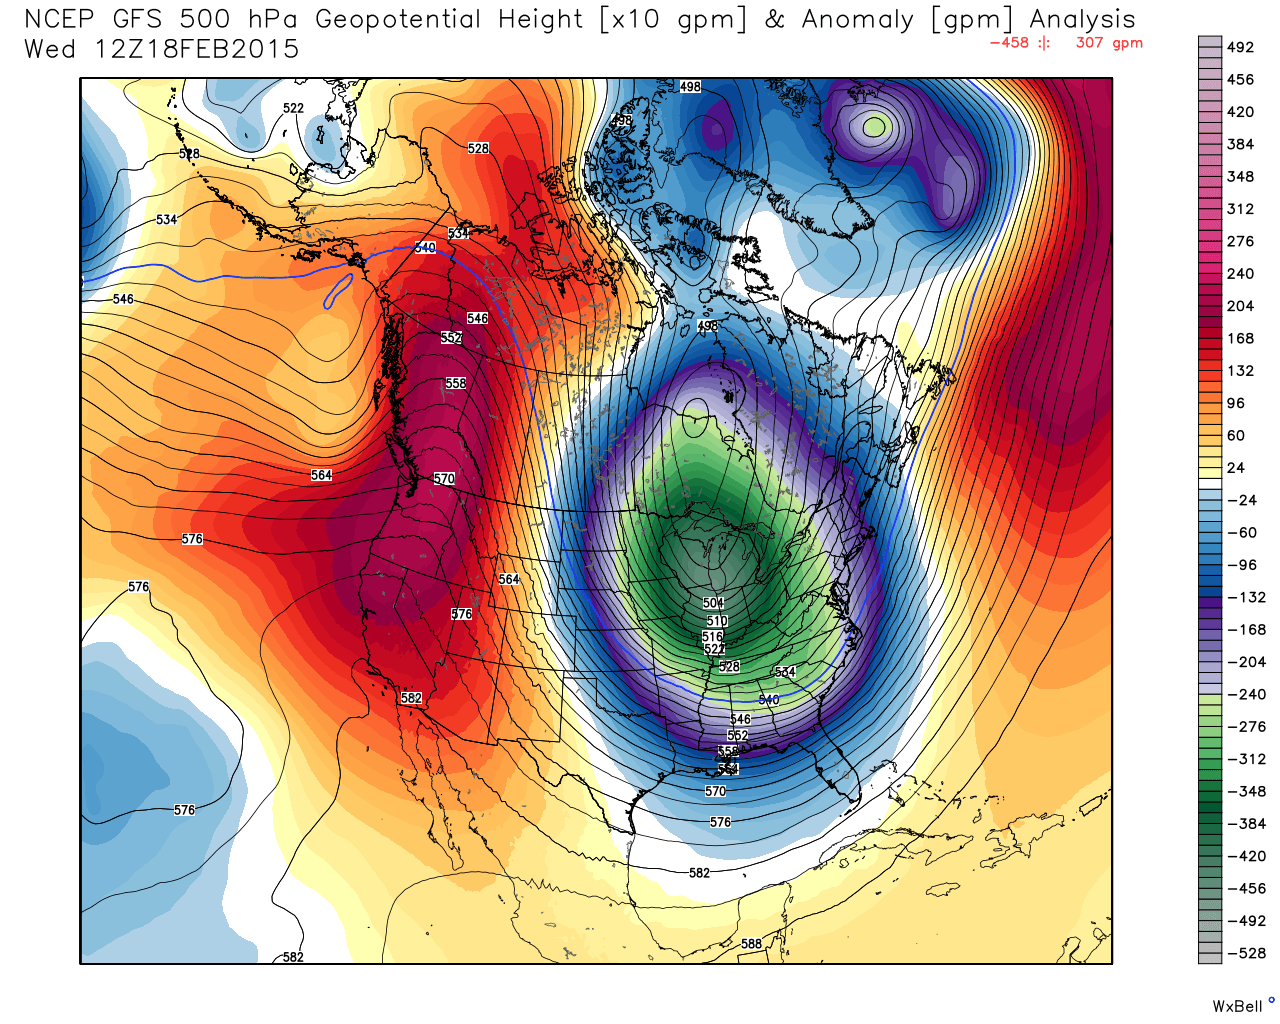
Getting into February, the first half of the month was cold with overnight lows regularly dipping into the -15C to -18C range but by the 12th things were really beginning to tank. Blocking from the west (see image above) allowed wave after wave of arctic high pressure, and I’m talking deep arctic air to dive south through Manitoba and into Ontario and Eastern Canada where we just simply froze.
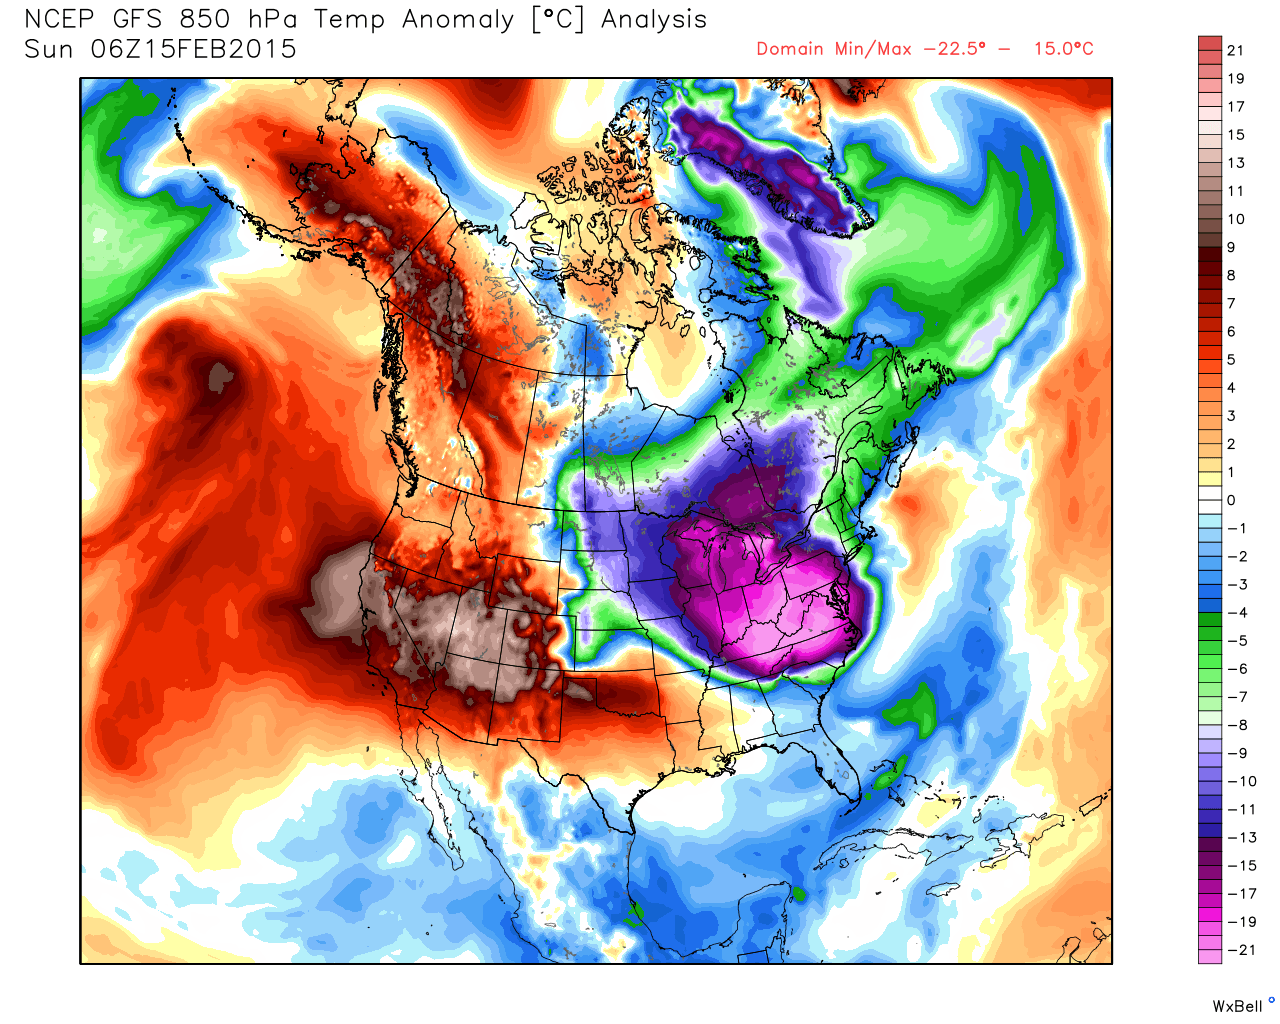
Pictured above is the 850MB temperature departure from normal on Feb 15th which was and so far remains the coldest overall day of the current winter and past winters going back to at least 2007. Not only was it just freezing, but this was the first time I’ve actually recorded a windchill in the minus 40’s. If your wondering, the windchill hit a whopping -41.7C / -43.1F at 8:06AM as the mercury dipped to -25.7C with a wind speed of 40.2 km/h pushing the scales to a new unseen low since my record keeping began back in 2010.
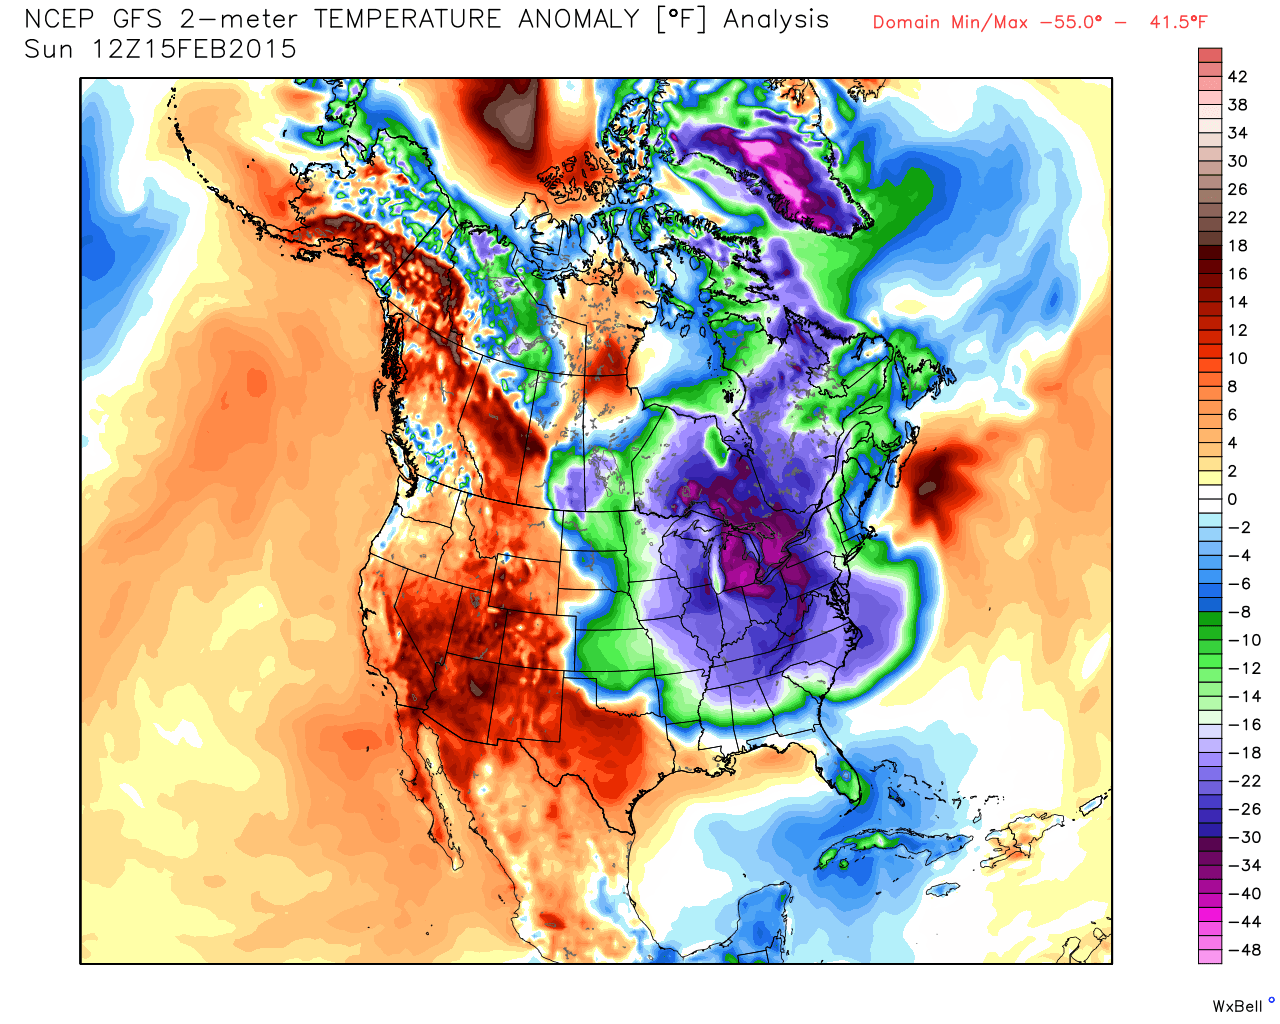
Wind chills and perceived temperatures aside, the actual 2 meter temperature departure from normal was not only on the order of some 15 degrees Celsius but the extent of the cold air was impressive with the Bahamas, Florida and Cuba getting a taste of the winter. Did I mention that much of the eastern half of North America was also freezing?
In the above graph, I’ve merged the February’s of 2012 through 2015 to show how progressively each February has actually become colder. In 2012 the mean temperature was -0.5C and by 2015 it has now dipped to -12.2C with a significant portion of that departure occurring in the second half of the month. Also interesting to note is that the entire month has been below freezing without a single day allowing for any thawing.
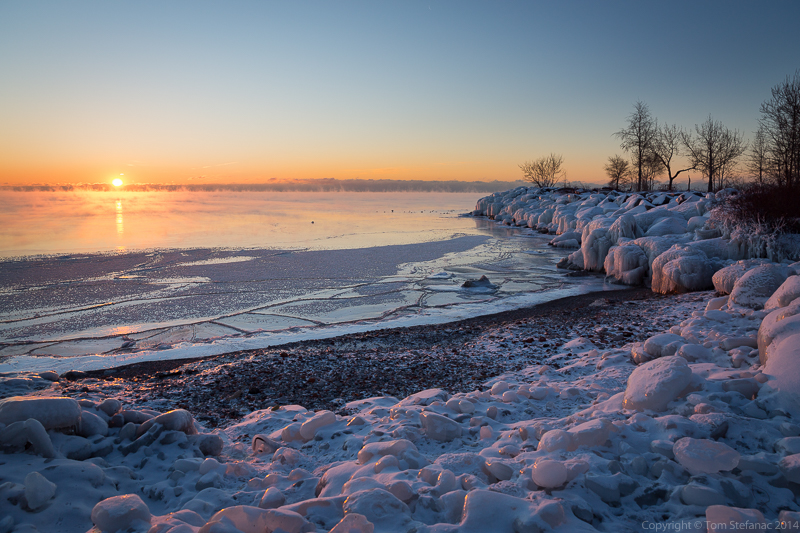
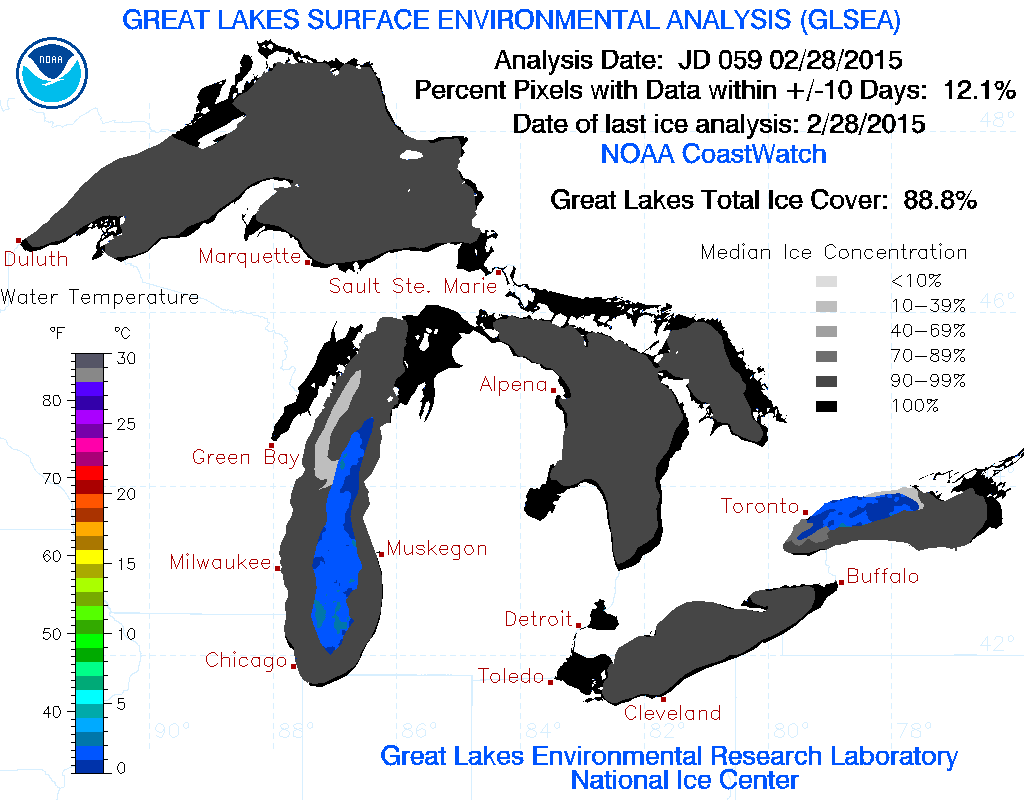
Actually the last above freezing day was January 24th which means it has been below freezing at my home in Vaughan for 35 consecutive days. This has also had the net effect of helping to lower the frost line progressively closer to the to the 60cm / 2ft mark which would be disastrous for many peoples water lines. The Great Lakes have also been feeling the brunt of the cold with ice cover reaching record levels and shipping grinding to a stand still.
The biggest question now is what will March hold? From the looks of the CFS and other climate models, the trend of cooling for the given forecast period looks to continue and spring may be much further than we would like to think!
 But in the meantime (get it? mean time?) I’ve included a map here from the CFS V2 summarizing February 2015 which has been below normal for the majority of North America and all of Greenland. The monthly climate summaries for February 2012 through 2015 are also located below.
January 7th 2015 – Arctic Blast


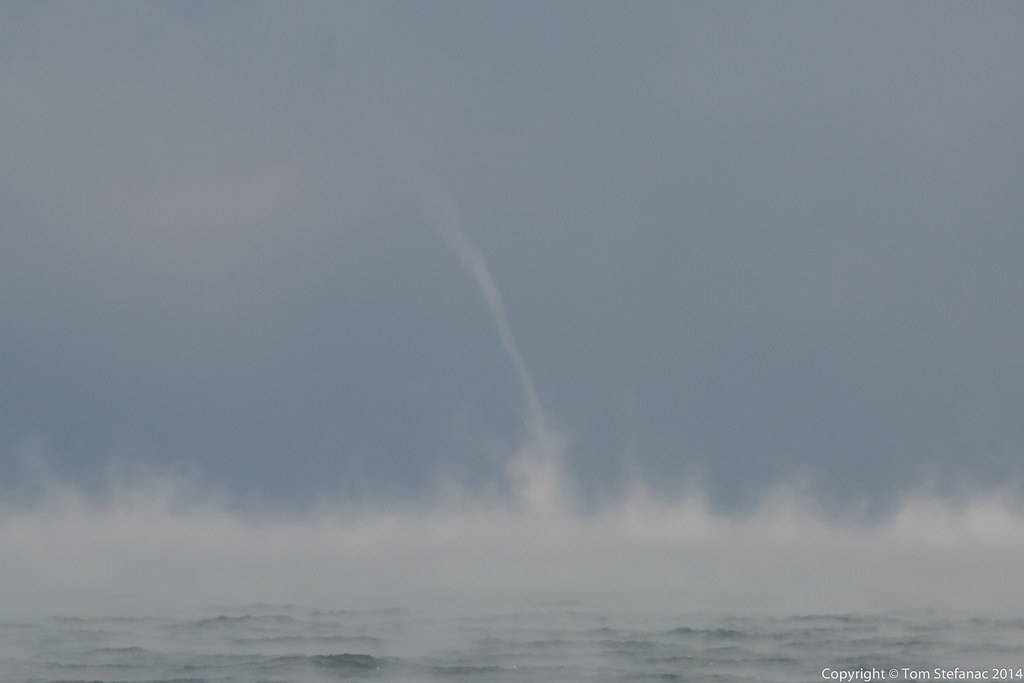
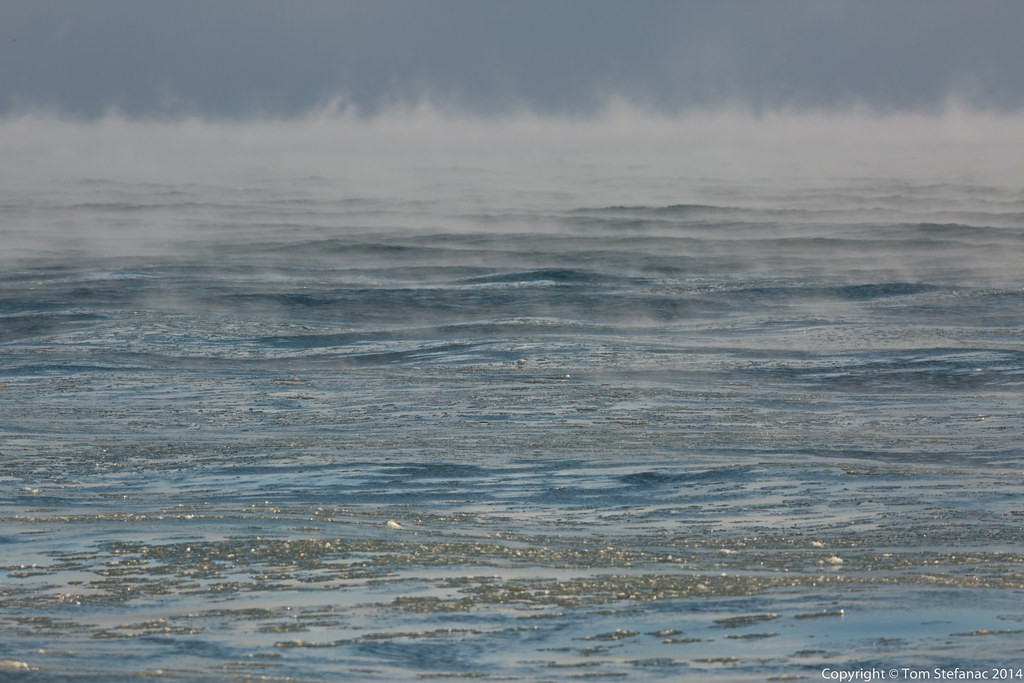

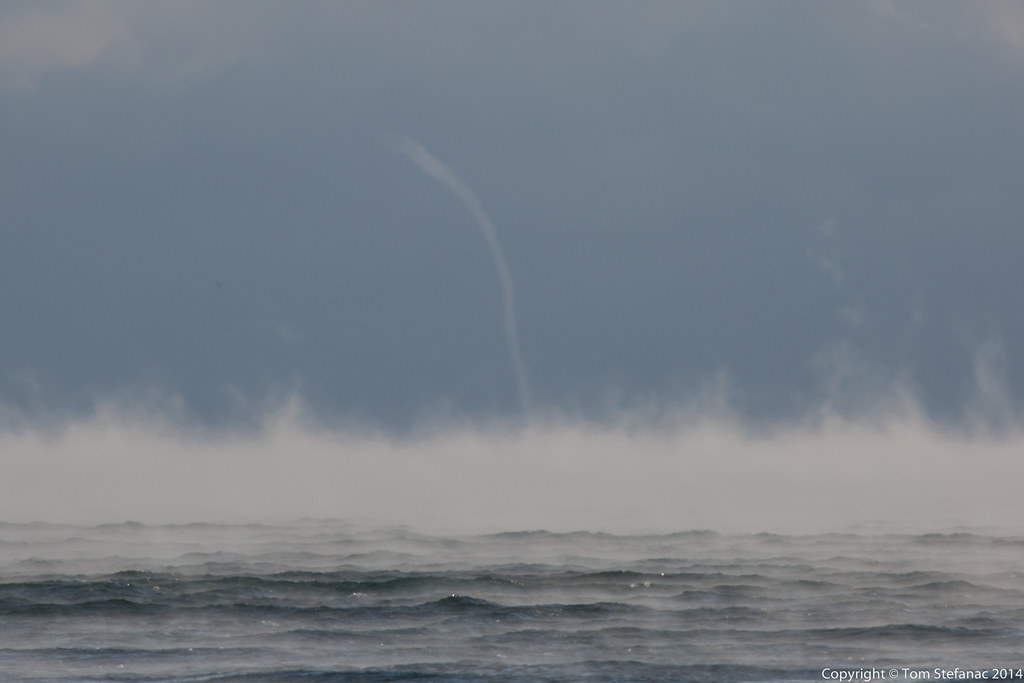
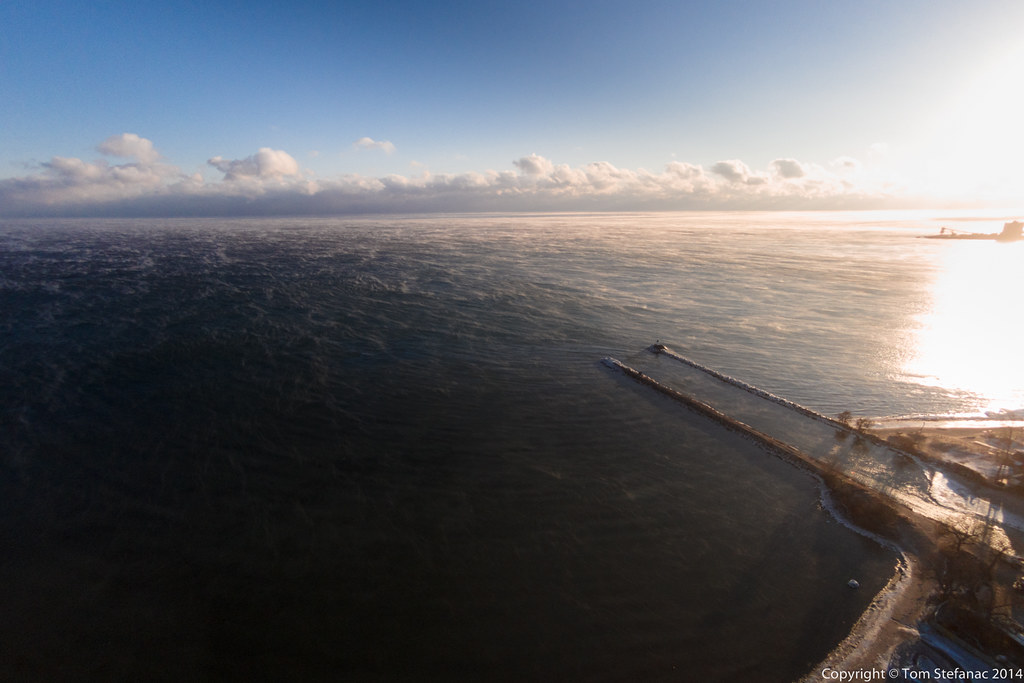
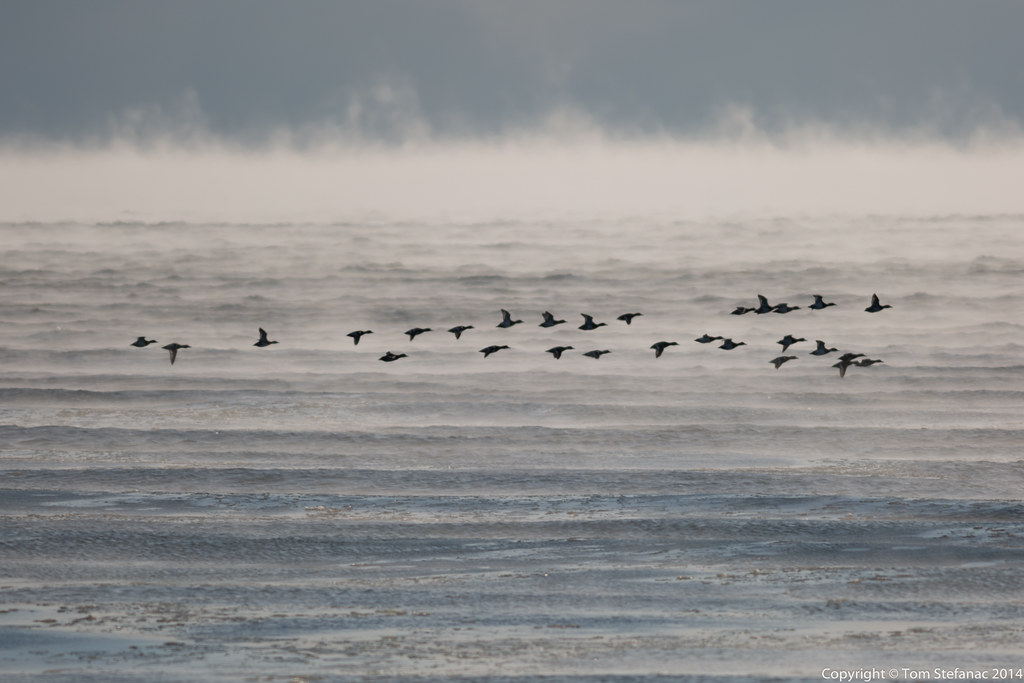
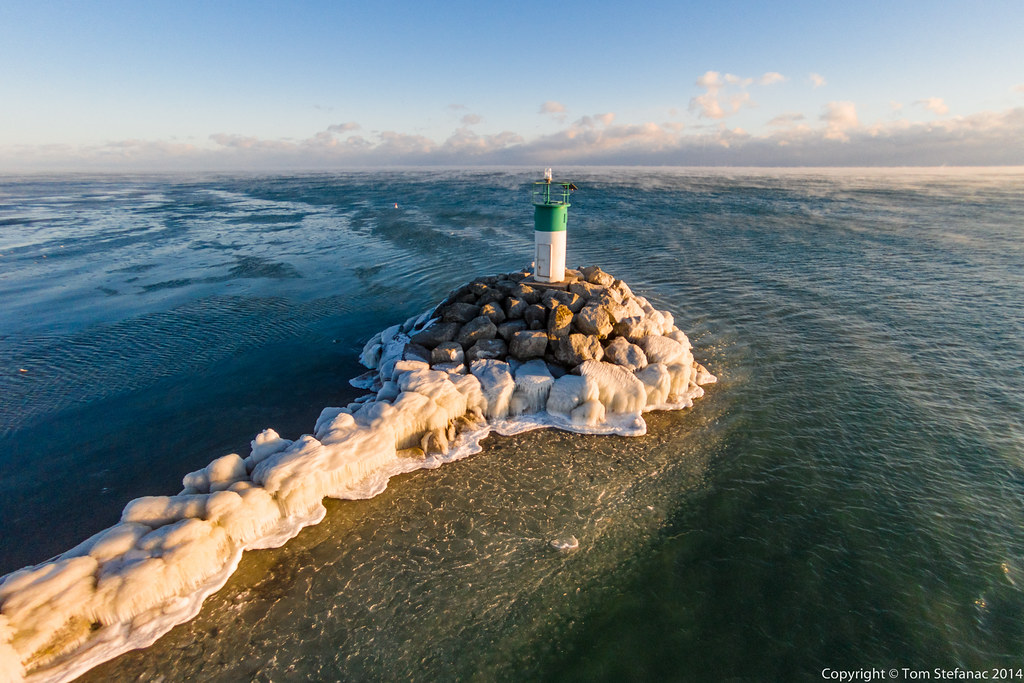


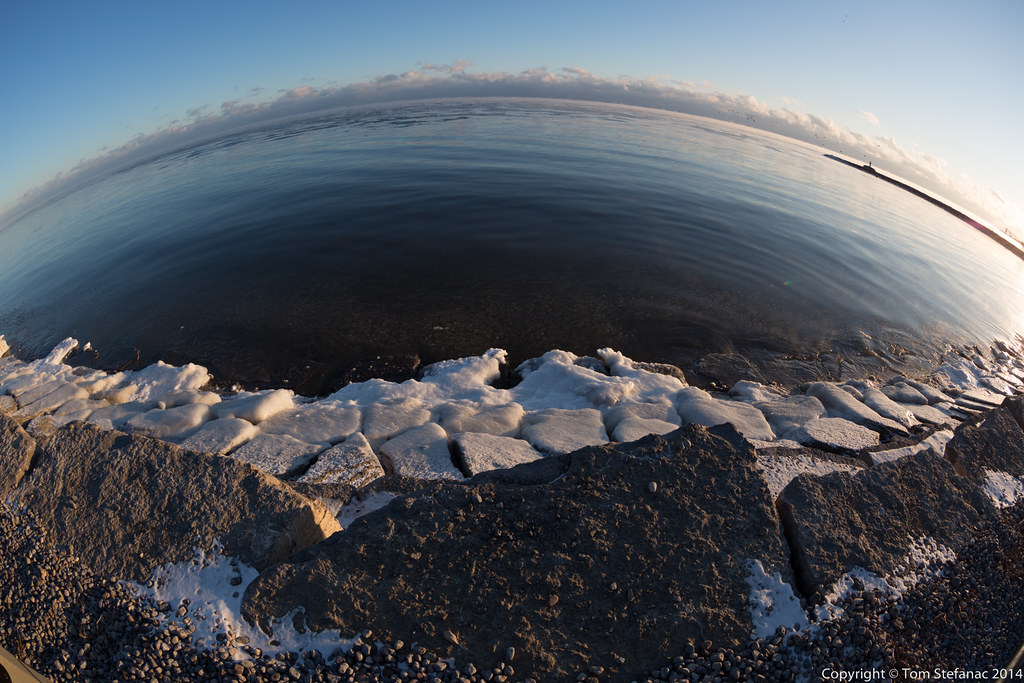


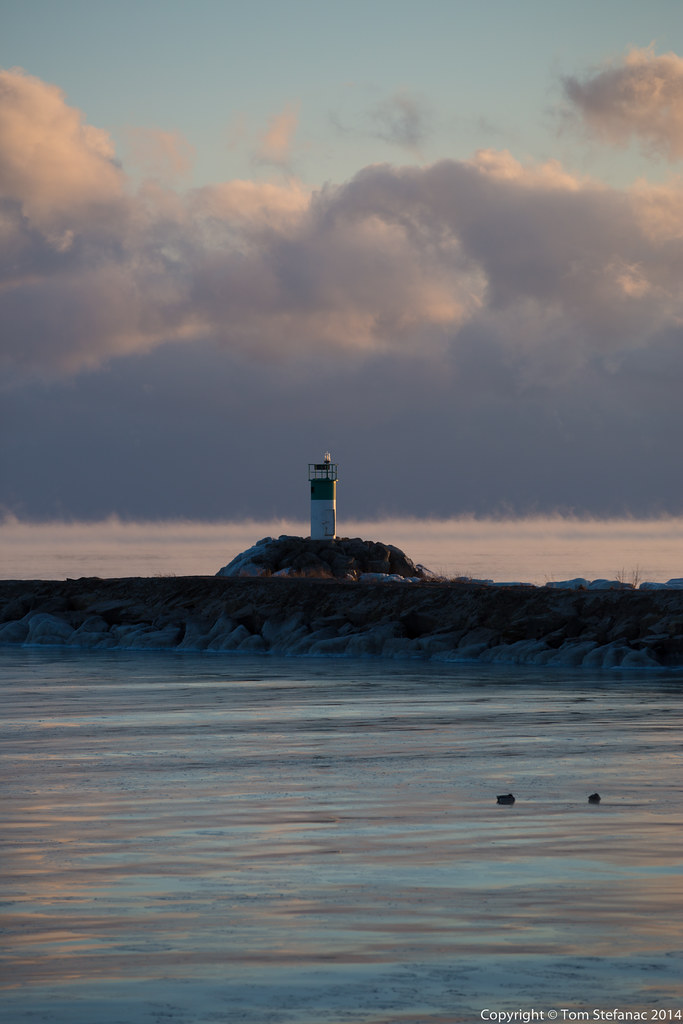


Here’s a brief video showing the steam devils in action!
The video is from 2015 but I still have 2014 on my mind so ignore that error! There’s also no audio because some nearby hunters kept firing off their .22 and missing the Geese they were trying to hit. So it was a little annoying.